
Digital Photogrammetric Workstations
Status and Features
For over a century, images taken from above-ground platforms have been major data sources for topographic mapping, creation of base maps and many other uses. For the past decade or more, data has been extracted from the imagery using computer software on what have become known as digital photogrammetric workstations (for short: DPWs). Some of the tasks can be performed almost fully automatically while others require extensive human involvement. To tie in with the new product survey on digital photogrammetric workstations published on our website, this article discusses the latest status and features.
Task Photogrammetry
These predecessors of digital photogrammetric workstations can be regarded as analogue computers. Such instruments constituted the main tools for topographic mapping right up until the 1970s and, now equipped with digitising encoders, they can still be found as workhorses in some topographic mapping agencies today.
Analogue to Digital Photogrammetric Workstation (DPWs)
The emergence of computers enabled human operators to measure photo coordinates directly in digits, with the computer transforming them into 3D object-space coordinates. The first such analytical plotter was introduced in 1957, and they gradually replaced analogue systems over the years until themselves being surpassed by DPWs around the turn of the millennium. The digital systems of today basically consist of software modules that run on off-the-shelf personal computers (PCs) which may have a special mouse, stereo-viewing hardware and sometimes hand and foot wheels or other devices attached to them to support specialised (mapping) tasks. However, the computational power of the PCs should be high. The CPU clock frequencies should be written in GHz and RAM memory in GB while the hard disk should store at least one terabyte to enable smooth processing of large blocks. The major difference between an analytical and a digital system is the availability of the image radiometry as pixels - enabling the automation of any workflow in principle, although automation is limited in practice.
Different Products for Different Photogrammetry Tasks
Though the basic task of photogrammetry is to arrive from planar image coordinates at 2D or 3D object coordinates in a geodetic or other object-space based reference system, the products are diverse. The arrangement of the object coordinates may be sets of 2D coordinates where each set defines the outline of a dwelling, office, factory or another object. The coordinates of corners and other characteristic points are stored sequentially to allow for reconstruction of the outlines as a line drawing.
2D Feature Extraction & Vector Mapping
This application is usually called 2D feature extraction, vector mapping or simply mapping. Another product consists of a point cloud of 3D coordinates, either irregularly arranged and tied together as a Triangular Irregular Network (TIN) or regularly distributed over a grid or raster. The points do not refer to characteristic points of buildings or other features, but are sample points of a continuous, curved surface either constituting the bare-ground surface (Digital Elevation Model or DEM) or the surface umbrella including the roofs of buildings (Digital Surface Model or DSM).

DEMs (Digital Elevation Model) and DSMs (Digital Surface Model)
Using image-matching techniques, DEMs and DSMs can be generated automatically from two or more overlapping images. Matching algorithms have been developed ever since images could be stored as pixels; there are many different methods, and improvements are continually being made. Contour lines can be automatically derived from the DEM/DSM and drawn on topographic maps or superimposed onto ortho-images.
By using the original images and the corresponding DSM, ortho-images/mosaics can be automatically created. Since reliable and accurate planar coordinates can be extracted from ortho-imagery, they are often used as backdrops for map-updating and GIS applications; sometimes the third coordinate - that is, the height component - is extracted from an underlying DEM or DSM in an approach called mono-plotting. The most advanced product comprises 3D city models, which can be created from nadir aerial images alone. However, to improve automation and to obtain detailed texture, additional datasets are usually explored, such as existing outlines of buildings, Lidar DEMs/DSMs, ground-based imagery or aerial oblique imagery.

Aero-triangulation and Block Adjustment
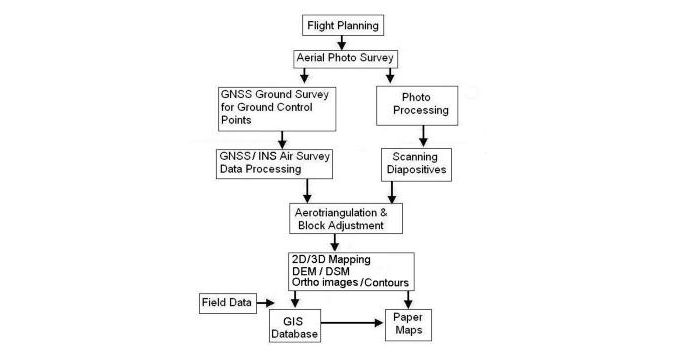
The above products cannot be created without pre-processing steps: most important is aero-triangulation and block adjustment, both aimed at georeferencing all data extracted. These steps require ground control points (GCP). A GNSS receiver and an inertial navigation system (INS) on board the plane during aerial survey enable a substantial reduction in the number of GCPs without loss of accuracy, thus saving time and money. Figure 2 shows the digital photogrammetric processing chain for aerial film frame imagery.
Stereo Vision & Manual Mapping
The most labour intensive task is manual mapping of roads, buildings, bridges and other objects/features, a task which is miles away from automation. The human ability to see a realistic 3D model of the scene when two overlapping images taken from different viewpoints are presented to the eyes - one image to the left eye, the other image to right eye - is extensively used to make mapping quicker and easier. There are four main methods of viewing a scene in its full three dimensions.

The 3D model can be seen through glasses, one covered with a red transparency and the other with a blue one. This anaglyph method is cheap but since only black-and-white images can be processed, a most important visual clue - colour - gets lost.  Another method using passive glasses but which allows colour to be seen is based on different polarisation of the left image and the right image (Figure 3).
The glasses are polarised accordingly. As with anaglyphs, the glasses are comfortable but entail loss of light due to polarisation. The fourth method does not experience loss of light as it is based on active glasses. The left and the right images are projected alternately on screen at a frequency of 50Hz or 60Hz - the alternating current voltage in that particular country. The operator wears liquid crystal glasses; when the left image is on screen, the right lens becomes opaque and vice versa (Figure 4).
Origin of DPWs
DPWs emerged from several directions, but basically three origins may be distinguished: aero-triangulation/block adjustment, mapping and supporting the GIS specialist. Inpho's DPW originates from research activities in the sixties and seventies for performing highly accurate and reliable block adjustment. To automate aero-triangulation matching techniques were incorporated to accurately locate user-definable fiducial marks as well as tie points without human intervention. The matching techniques appeared also beneficial for DEM/DSM generation, enabling automatic creation of ortho-photos, ortho-photo mosaics and contour lines. The strength of matching procedures surfaces in dunes, along beaches and other poorly textured areas as well as in mountainous areas. However, the system has not been developed for manually measuring points from images viewed in stereo mode. To enable mapping, the system can be attached to the feature extraction software of DAT/EM System International which allows importing vector data measured by a human operator into common GIS packages, including ArcGIS, AutoCAD and MicroStation.
On the other hand, many manufacturers, such as Racurs, Espa and Intergraph, offer systems which can execute all photogrammetric steps without support of third party systems. Racurs also offers separate modules for generating DEMs/DSMs from Synthetic Aperture Radar (SAR) imagery using both interferometry techniques and radar stereo pairs. ESPA, which focuses on data extraction from airborne images and Lidar, offers a complete set of modules up to the automatic transfer of 3D features to GIS environments.
Intergraph LPS (formerly Erdas) also consists of a complete suite of modules. A typical system originally designed for mapping from scanned aerial photos is KLT Atlas DSP. Today it can also perform aero-triangulation/block adjustment and many other steps on imagery stemming from a variety of sources. Systems which did step into the arena from the GIS side are Photopol Atlas and Strabo.
The main product of Topol Software Company, manufacturer of Photopol Atlas, is a GIS system in use in forestry, land management, precision farming and other applications. Strabo, developed by Orbit Geospatial Technologies, is an extension of OrbitGIS.
At some point, most GIS specialists discover that some of the data needed to manage forests, to design a new settlement on the outskirts of a city, to carry out land consolidation or a range of other tasks is not available off-the-shelf; they have to extract the data themselves from aerial or satellite imagery. To serve these users, GIS vendors offer functionality on top of their GIS systems.
Beneficial Features
Most manufacturers deliver scalable solutions by offering separate modules each focused on a different task, thus enabling the DPW to be personalised as required. Photomod, for example, consists of 11 modules in addition to the main shell necessary to run the individual modules. Increasingly photogrammetric data extraction is carried out at scattered locations. Aero-triangulation may be carried out in Stuttgart, DEM/DSM generation and creation of ortho-mosaics in Moscow, while manual 2D or 3D feature extraction is performed in Hyderabad, New Delhi, Mumbai or Bangalore. Multiple DPW modules spread across several locations and working together increase productivity and shorten delivery time to the client.
DSMs suited for automatically creating 3D city models
Another topic to be examined is the types of images which can be handled. These should of course correspond to the tasks at hand. To check the results of block adjustment, visual inspection tools make it easier to examine overlaps, configure GCPs and tie points, check residuals and error ellipses. When the images have at least 60% along-track and 60% across-track overlap, some systems are able to automatically create reliable and accurate DSMs suited for automatically creating 3D city models, as both heights and textures can be extracted from the same images. This avoids performing expensive Lidar surveys when they are not available from third parties at affordable prices. When images, sometimes from different sources, are joined together, intensity and colour variations are inevitable, resulting in ortho-mosaics appearing as patchworks. Some DPWs provide utilities for automatic correction.
Concluding Remarks
This article focused on the status and features of DPWs. How will the future of photogrammetry, and in particular of DPWs, look? I outline likely developments for the coming decade in my Endpoint column.
Further Reading
Lemmens, M., 2011, Geo-information: Technologies, Applications and the Environment, Chapter 7, Springer, ISBN 978-94-007-1666-7

Value staying current with geomatics?
Stay on the map with our expertly curated newsletters.
We provide educational insights, industry updates, and inspiring stories to help you learn, grow, and reach your full potential in your field. Don't miss out - subscribe today and ensure you're always informed, educated, and inspired.
Choose your newsletter(s)


