Lidar Quality Assurance
Open-Source Software For Processing Lidar Point Clouds
Basic tools for processing Lidar point clouds, which can be extended depending on needs, provide a flexible platform for service providers and users alike. Here, the authors demonstrate how a publicly available open-source application with basic tools for visualising, editing and analysing Lidar point clouds has been extended into a compliant platform that serves diverse applications including mapping of power-line corridors, land uses and riverbeds.
The platform, called DielmoOpenLiDAR and released under the GNU GPL licence, enables management and display of massive Lidar datasets together with vectors, rasters, OGC services such as WMS, WFS, WCS and other geoinformation. For professional users, the key benefits are the simplicity of implementing new algorithms to generate any output and the possibility to launch these algorithms easily in a tile structure, thus allowing processing on different computers to improve speed. The platform is based on open-source software, primarily gvSIG and SEXTANTE. Open source enables the use of many functionalities for free, which reduces development costs and time, and the extension of services without any licensing costs.
Quality Assurance
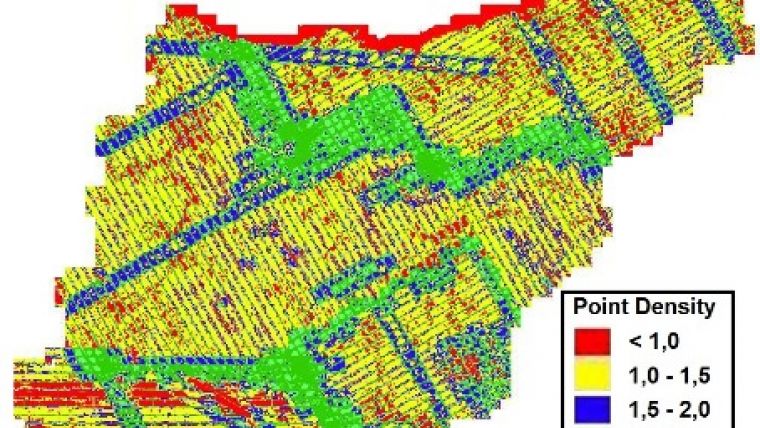
The core of the platform is the quality assurance (QA) part, which enables basic statistics to be derived from the headers of the LAS files, in particular the bounding boxes of the captured areas and tables (Table 1). Added to this, statistics are determined about the area captured by every flight line, including the shape of the area captured in a flight line together with a table (Table 2). The QA module also computes height accuracy using ground truth and the redundancy in the overlaps between flight lines. A check on completeness is performed by indicating regions with gaps, which usually correspond with water bodies but may also concern areas which have erroneously not been captured. Furthermore, the software outlines the point density of regions as intervals indicated by the user and thus also highlights the regions that do not comply with the point density requirements (Figure 1). A measure of matching errors is obtained from height differences of points in flat areas within overlaps.

Value staying current with geomatics?
Stay on the map with our expertly curated newsletters.
We provide educational insights, industry updates, and inspiring stories to help you learn, grow, and reach your full potential in your field. Don't miss out - subscribe today and ensure you're always informed, educated, and inspired.
Choose your newsletter(s)


