Mapping Flood Vulnerability
Deriving Risk Indicators from Open Data
Floods have a high impact in densely populated areas, especially when strategic infrastructure is affected. There are various human and territorial factors that influence an area’s vulnerability to flooding. Intensive agricultural activity and large urbanised areas are examples of such human factors, while the soil’s ability to absorb water is a major territorial factor. A quantification of flood vulnerability can be created by combining numerical indicators for the various factors into a single index number that is easy to interpret for decision-makers. GIS tools can easily be applied to calculate these indicators from various open spatial data sources, offering a low-cost methodology to produce vulnerability maps.
The risk of devastating floods is being increased by heavier and more frequent rainfall due to climate change, as well as by the removal of vegetation and soil that used to absorb water. Flooding can damage infrastructure and buildings, costing human lives and causing considerable economic losses. Decision-makers need to estimate how susceptible various elements are to the impact of flooding. This is called ‘flood vulnerability’. Maps that show the spatial distribution and quantify the vulnerability of at-risk elements facilitate decision-making. The challenge is to quantify multiple human and territorial factors and express flood vulnerability as a single index number.
The severity of flood damage depends on how many people live in an area, the economic value of land and the density of buildings, roads and other infrastructure. These factors are combined to form the human vulnerability index. Furthermore, the extent of the area affected by flooding depends on the ability of the soil to absorb water and on the presence of dams, dykes and other flood-protection infrastructure. If local protection volunteers or early warning systems, such as monitoring stations, are present in an area, the vulnerability will be lower. All of these factors are included in the territorial vulnerability index.
Vulnerability index
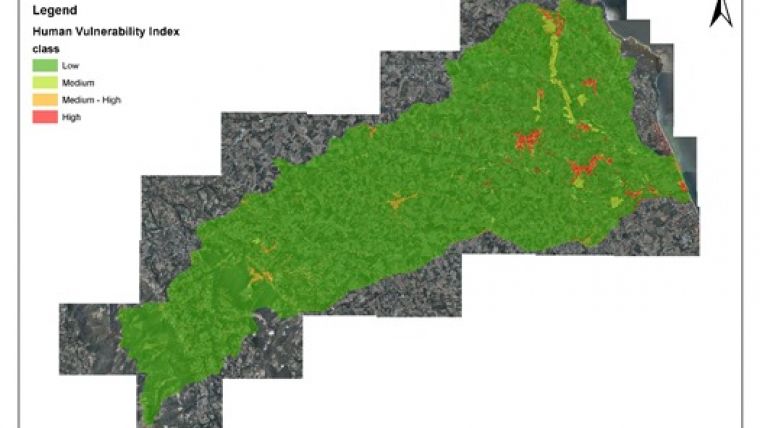
The overall vulnerability index ranks the vulnerability based on four classes: low, medium, medium-high and high. Its calculation combines two main components: the human vulnerability index and the territorial vulnerability index (Table 1). Commonly available open spatial datasets can be used in GIS to calculate the factors each index comprises.
The human vulnerability index includes three factors:
-
Human system indicator (HSI): the normalised percentage of people younger than 5 years of age and older than 65, multiplied by population density within a given municipal area. This is a combination of statistical data and municipal boundaries.
-
Social system indicator (SSI): the type of land cover from land-use maps, ranked based on estimated population density as an indicator of economic damage.
-
Infrastructure system indicator (ISI): the summation of the type of road(R) from road maps and number of buildings per square kilometre from topographic maps, assigning the highest value to hospitals (B).
The territorial vulnerability index also takes into account three factors:
-
Monitoring and prevention system indicator (MPSI): the summation of the number of hydro- meteorological monitoring stations and local civil protection volunteer corps per square kilometre within a given municipal area. Meteorological-hydrological monitoring networks can provide these numbers which can be combined with maps showing municipal boundaries.
-
Morphology indicator (MI): the ability of the soil to absorb water. This data is gained from geological maps.
-
Waterway infrastructure indicator (WII): the highest ranking for flooded areas, for example in case of opening the bottom outlet of a dam. Maps with predicted flooded areas from hydrologic and hydraulic models in combination with topographic maps are needed, and these are usually provided by dam owners.

Value staying current with geomatics?
Stay on the map with our expertly curated newsletters.
We provide educational insights, industry updates, and inspiring stories to help you learn, grow, and reach your full potential in your field. Don't miss out - subscribe today and ensure you're always informed, educated, and inspired.
Choose your newsletter(s)


