Monitoring Vulcanoes with UAS
Testing the Suitability of Thermal Infrared Sensors
Insight into signs that prelude volcanic eruptions is key for protecting the lives, livestock and property of those living in the vicinity of a volcano. One key indicator is temperature rise. Using Mount Etna as a test site, the authors show that a UAS equipped with a thermal infrared sensor generates data similar to temperature data acquired by ground-based stations while avoiding safety risks for volcanologists.
Data from Earth observation satellites with high temporal resolution can be used to monitor volcanic eruptions on an intraday basis when combined with images from satellites with a high GSD but low repetition time. For example, MODIS captures about four images per day of the same area with a ground sample distance (GSD) of 1km. This data can be combined with images from ASTER (Advanced Spaceborne Thermal Emission and Reflection Radiometer) which has a GSD of 90m in the thermal bands and a revisit time of 16 days. The resulting data enables indication of low-altitude emissions and the growth of domes and lava flows, and detection of course thermal anomalies.
However, forecasting volcanic activity requires also data on quacks, ground deformation, detailed temperature rises, gas emissions and other signs. These cannot be collected by satellite sensors but instead require in-situ visits. With their remote locations, well above sea level, volcanoes are difficult to monitor in regular site visits, while the use of manned aircraft for capturing time series of thermal images above volcanoes is costly and risky. Therefore, Istituto Nazionale di Geofisica e Vulcanologia (INGV) in Rome, Italy, started to investigate the usability of a UAS in 2004 by flying a remotely piloted fixed wing over the Stromboli. As the initial results were encouraging, the experiments were continued using a rotary-wing aircraft enabling vertical take-off and landing, low speed up to hovering and high manoeuvrability. These are all favourable features for inaccessible terrain.
UAS and Payload
The pilot project described here used a rotary wing with six propellers, each powered by an electric motor and mounted rigidly to a low-weight carbon-fibre structure. The hexacopter in question can conduct a single waypoint autonomous flight, can be manually controlled through a radio link and can stay in the air for 15 minutes. It can hover above a fixed point, carry a payload of 1.7kg and allows for an emergency landing in case of propeller failure. The on-board controller integrates GPS, IMU, magnetometer and barometer data to perform autonomous flights. A tablet PC acts as the ground station. The payload consists of a Thermal EYE3600AS (TE 3600AS) based on proven amorphous silicon (AS) microbolometer technology. The TC (Thermal EYE 3600) weighs 67 grams, captures the thermal band from 7 to 14 micrometres and generates PAL video at a frame rate of 25Hz. The customised solution consists of four PC-104 compliant stackable modules:
- DC-DC converter offering up to 75W for powering all modules
- Real-time PAL/NTSC Frame Grabber controller for PC/104+ bus
- PC with low power running Windows XP; a specific driver able to store each video frame on a 4GB compact Flash
- Wi-Fi for wireless connection.
The system is integrated in a cube of 12 x 11 x 8cm3 and weighs 600g.
Field Survey
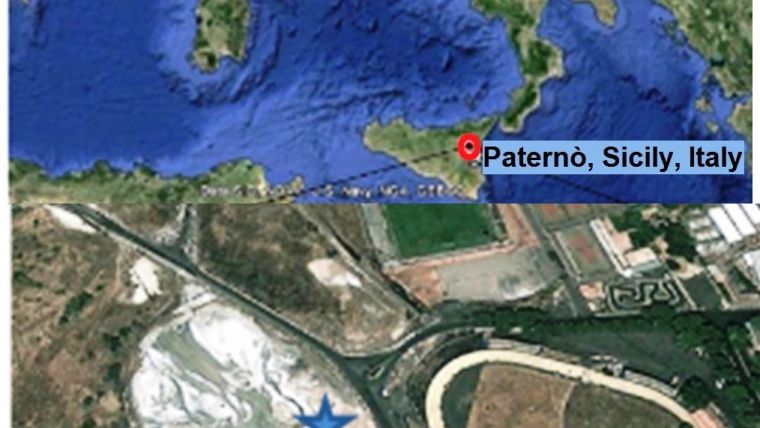
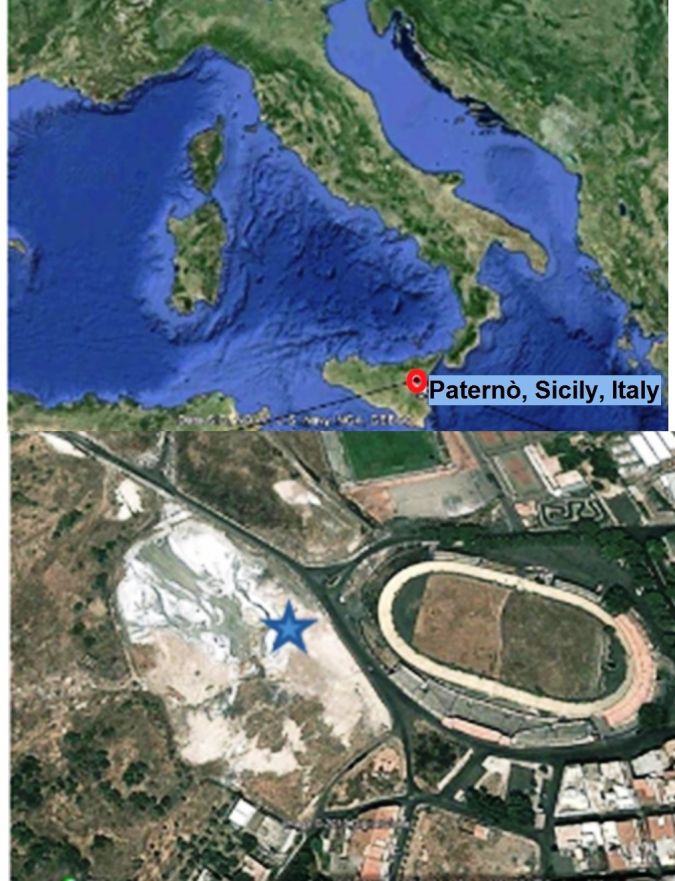
The field survey was conducted on 26 June 2012 at Le Salinelle, a mud volcano located on the southwest flank of Mount Etna and passable only with difficulty, which hampers in-situ measurements (Figure 1). Emissions of mud, salt water and gas are related to early stages of magma accumulation and thus form tokens of increased volcanic activity. The temperature of the salt water usually varies between10 and 20°C but sometimes rises to 40 to 50°C which is in line with an increase in gas emission and thus forms a token of a forthcoming eruption. In order to avoid sun reflection and heat release from the ground, the survey was conducted in the late afternoon when the air temperature was around 30°C. The UAS was remotely piloted by a human operator. During two flights, each lasting 15 minutes, two areas were mapped and the thermal video frames were transmitted to the ground station in real time. The same area was also captured by a calibrated A310 forward looking infrared (FLIR) thermal camera for reference purposes. The A310 used contains a 320 x 240 array, which captures the 8-14 micrometre thermal band and is sensitive to temperatures from 0 to 350°C with an accuracy of ±2%. The camera was handheld by a human operator which resulted in a high oblique view. Added to this, a Fluke infrared thermometer was used for obtaining an independent validation measurement at a selected area.
Results
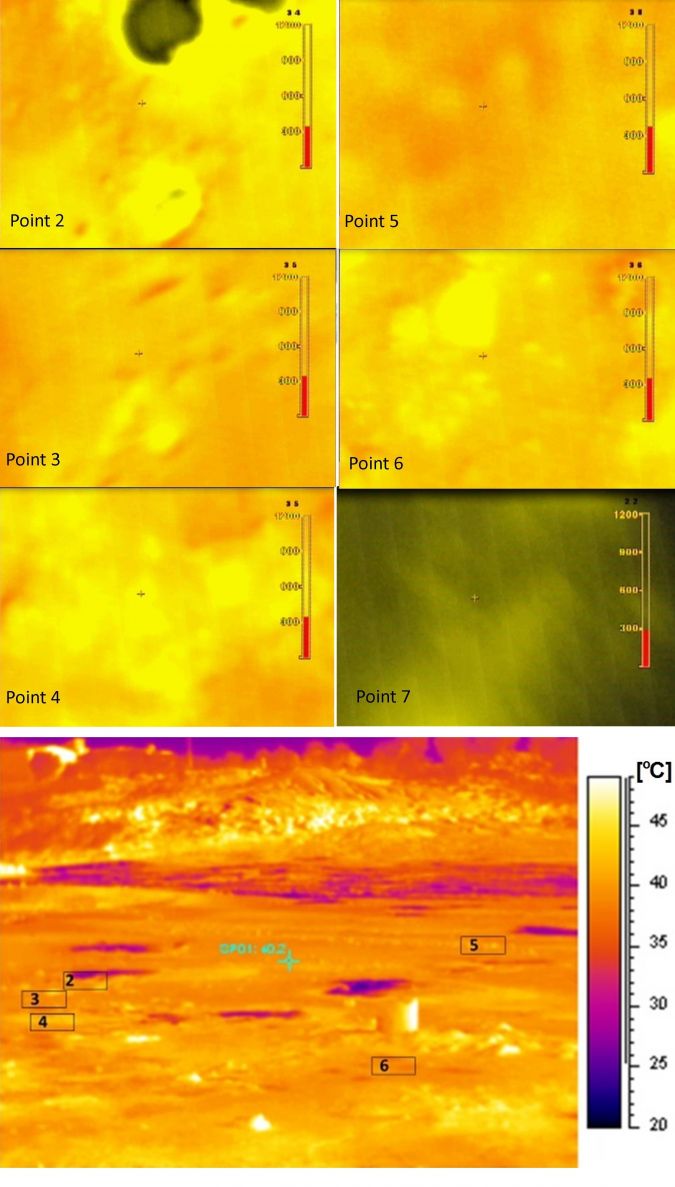
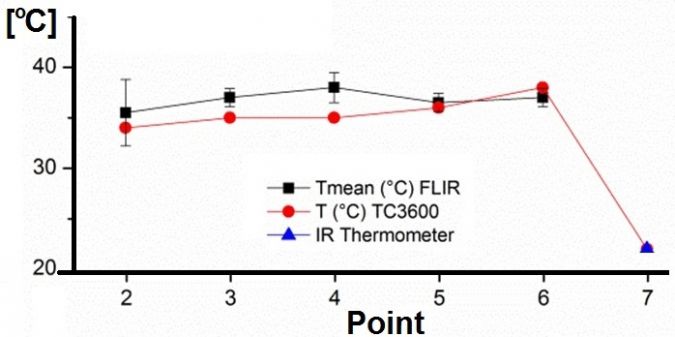
After manual co-registration of the A310 and TC3600 imagery, six frames from the TC3600 UAS imagery were selected (Figure 2). The average temperatures of five frames (points 2 to 6) were compared with the averages of the ground truth collected by the A310 and the results plotted in Figure 3. The cross correlation between TC3600 and A310 is 0.64. The values of the A310 for points 3 and 4 show a large standard deviation due to the presence of a hotspot. One frame (point 7) acquired during the second flight was compared with the Fluke infrared thermometer and shows perfect resemblance.
Concluding Remarks
The system worked properly also under harsh conditions, demonstrating that UAS thermal imaging is a promising technique for acquiring data in volcanic areas which are difficult to access. To date, has been INGV involved in thermal mapping of volcanoes in various countries.
Acknowledgements
Thanks are due to Salvatore Giammanco, Letizia Spampinato, Maria Fabrizia Buongiorno, Fabrizio Giulietti, Mario Gattelli, Massimiliano Pompignoli and Alessandro Ceruti.

Value staying current with geomatics?
Stay on the map with our expertly curated newsletters.
We provide educational insights, industry updates, and inspiring stories to help you learn, grow, and reach your full potential in your field. Don't miss out - subscribe today and ensure you're always informed, educated, and inspired.
Choose your newsletter(s)


