3D City Models
Supporting Tool for Urban Planning and Design
Abasabad in the north of Tehran has been designated a development area to serve the millions of people living in the metropolis. In order to progress from general zoning plan to detailed designs of buildings, roads, green zones and playgrounds, accurate and detailed geo-data was required, preferably in the form of large-scale digital maps and 3D city models. The authors describe how they produced this type of 2D and 3D geo-data using high-resolution digital aerial imagery and scale 1:500 maps.
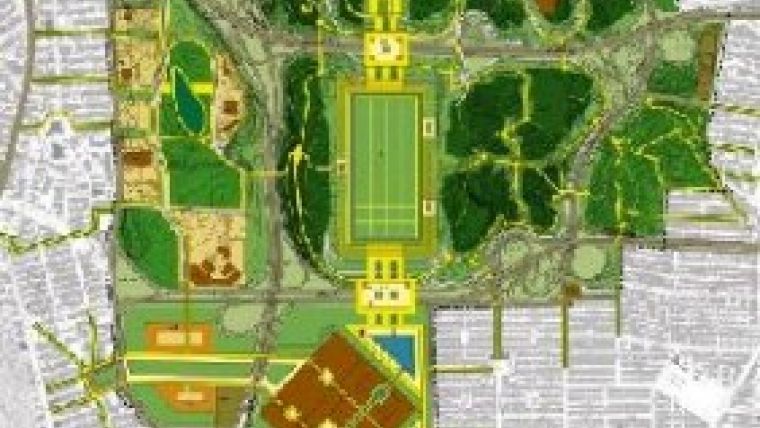
Tehran, the capital of Iran, is bordered in the north by mountains and in the south by desert, and is a city undergoing rapid growth, to some extent organically. In 2005 the Iranian authorities approved a general zoning plan to develop Abasabad into an area where the millions of people living in the metropolis could enjoy cultural, recreational and leisure activities (Figure 1). Abasabad is one of the four hills of Tehran, located in the north on the promontory of the Alborz Mountains and covering an area of 623 hectares. The height difference between the highest and lowest point is 180 metres.
Design Requirements
Realisation of the approved general zoning plan requires detailed architectural designs of all future buildings, roads and other objects, along with their spatial location and orientation. Architects and planners should be enabled to quickly assess feasibility, errors or areas of conflict between alternative designs. As a vital basis for design development and assessment, they also need accurate topographic and land-use maps of the area. If possible and affordable they will want to utilise not only planimetric maps, but also 3D models of the area within which they can place alternative 3D designs of buildings, bridges, roads and other objects.
Aerial Mapping
Existing maps of Abasabad were outdated due to recent major changes in the area. The maps were also incomplete thanks to government land surveying restrictions which limit types of object represented on them. To arrive at maps representing the current situation on the ground the Iranian national mapping agency captured the area photogrammetrically during an aerial survey carried out in 2006 using an UltracamD digital camera. The images, recorded with a Ground Sampling Distance (GSD) of 10cm, were processed using the digital photogrammetric system Leica Photogrammtric Suite 9.0 (LPS). A reference network consisting of thirty easily identifiable and well distributed ground points was established over the area. The points were used partly as ground-control points in the areotriangulation procedure and partly as checkpoints. The X, Y and Z coordinates of the reference points were measured using dual-frequency GPS receivers operating in static mode with an accuracy of 5cm root mean square (RMS) error in all three coordinates. After bundle adjustment, the coordinates of the checkpoints showed a RMS error of less than 10cm. Next to the above preparatory work, a digital elevation model (DEM) was automatically generated by applying the available image-matching techniques in LPS on the stereo pairs of aerial photos. Since the three-dimensional points resulting from automatic matching do not necessarily represent the bare ground, a manual editing stage carried out by human operator was required. Autocad 2007 was used to join the different DEM blocks generated from the individual stereo models into one seamless DEM mosaic with grid spacing of 20cm (Figure 2). Employing the DEM blocks, digital orthophotos were created using LPS and then mosaicked using Erdas Imagine 9.0.
Map and 3D Model
The above data was used as a basis for creating the photomap of the area and the 3D city model. To create the photomap, the mosaic of orthophotos was enhanced by adding outlines of buildings, transportation lines, trees and other objects as vector data extracted from the existing scale 1:500 map (Figure 3). This map was created in 2004 using traditional land survey methods. Its content is incomplete due to government restrictions; however, the representations of objects which had not undergone change since data capture could be fruitfully exploited as an accurate source for creating the photomap.
To make the 3D city model the orthophoto mosaic was first draped over the DEM, resulting in a photo-realistic surface of the area.
Next 3D building models and 2D urban plans were superimposed on the model. In addition to vector information, 3D objects of important buildings and landmarks were integrated to increase the visual attractiveness of the 3D model and better support the design process; the 3D objects were produced using Autodesk 3ds Max software. A 3D city model should be obtained quickly and provide an accurate, detailed and complete representation of the area to enable architects and planners to assess how their designs fit into the environment and whether they in any way conflict. For this purpose 3D city models were prepared at levels of detail LoD1 and LoD2. LoD1 consists of basic block models with flat roofs (Figure 4) while LoD2 represents architectural models with façade texture and proper building geometry (Figure 5). Designs developed by city planners where incorporated into these 3D city models using Autodesk 3ds Max environment. The merging of designs with representations of reality could be interactively explored using IMAGIS 3.2 virtual-reality software.
Concluding Remarks
Since the world around us undergoes gradual change, maps and 3D models need regular updating. The physical models created at different scales during the planning and design process supported the architects in effectively identifying design errors or conflict of interest. The use of 3D city models reduces cost and effort spent on preparing high-quality representations, map prints and physical models.
Acknowledgement
Thanks are due to Mr Atabaki, general director, Abasabad Novation Company, and to Mrs Khorasani and other staff.
Further Reading
• Buhur, S., Ross, L., Büyüksalih,G., Baz, I., 2009, 3D City Modelling for Planning Activities, Case Study: Haydarpasa Train Station, Haydarpasa Port and Surrounding Backside Zones, Istanbul, ISPRS proceedings XXXVIII-1-4-7 W5.
• Döllner, J., Kolbe, H.K., Liecke, F., Sgouros, T., Teichmann, K., 2006, The Virtual 3D City Model of
Berlin –Managing, Integrating and Communicating Complex Urban Information. 25th International Symposium on Urban Data Management UDMS, Aalborg, May, 15-17.
• Kibria, M.S., Zlatanova, S., Itard, L. & Dorst, M. van, 2009, GeoVEs as Tools to Communicate Urban Projects: Requirements for Functionality and Visualization. In: Lee, J. & Zlatanova, S. (Eds.):
3D Geo-Information Sciences.

Value staying current with geomatics?
Stay on the map with our expertly curated newsletters.
We provide educational insights, industry updates, and inspiring stories to help you learn, grow, and reach your full potential in your field. Don't miss out - subscribe today and ensure you're always informed, educated, and inspired.
Choose your newsletter(s)


