3D Modelling for Property Valuation in China
A High-resolution Remote Sensing-based Approach
Rapid urban development in China has transformed the cityscapes, with a dramatic increase in high-rise buildings. However, the current 2D property valuation methods neglect the vertical dimension, even though that aspect contains significant indicators that impact property value – such as types of views, scope of vision and daylight. 3D modelling of geographical data can help to change this in high-rise and high-density areas, going beyond 2D to enable identification of complex property characteristics in the vertical dimension too. This article presents research to explore a 3D modelling approach using remote sensing data for more precise property valuation.
The accelerating urbanization has put great pressure on land in China, posing a challenge of how to accurately define property characteristics and values. However, the integration of GIS and property valuation are mainly based on two dimensions. When it comes to handling the complexity of vertical developments in urban areas, current methods are incapable of describing a property’s 3D characteristics in detail and providing precise information on spatial variations between properties. In view of the considerable rise in property prices and the technical advancements in GIS, 3D modelling is becoming increasingly relevant for property valuation in urban areas in order to better describe the complex property characteristics, especially in the vertical dimension, as recent research in China shows.
Study area
Xi’an, the capital city of Shaanxi Province, is located in the mid-western area of China. Xi’an serves as the educational, political and economic centre of Shaanxi Province and wider northwest China. It also attracts tourists from around the world. Xi’an was chosen for the research project because of its data availability and its property market, which has particularly flourished over the past few years. Although it is both costly and time-consuming to investigate the effects of 3D indicators, the anticipated results at the neighbourhood scale can be useful, giving prospective buyers a fast estimate of the property price in a specific neighbourhood and also making the study feasible in terms of computation and data collection.
Higher level of detail
3D modelling and its interactive functions for property valuation has so far not been very popular among both the municipal government and the real-estate developers in Xi’an; it has only been explored by real-estate developers in a few large cities (e.g. Shenzhen). The Xi’an municipal government does use some 3D modelling, but mainly in the field of urban planning and the use cases are limited due to the low levels of detail (LOD) influenced by the huge cost, low technology and public security policy. However, 3D modelling can be developed to a higher LOD to serve more purposes in the future (e.g. emergency management). Real-estate developers utilize 3D modelling for architecture and landscape design, but they rarely use it for sales purposes because they believe/perceive the traditional 2D sales tools to be effective and intuitive. The reform of the Hukou policy has contributed to substantial population growth in Xi’an and is thus creating a higher demand for housing. Now that the property market in Xi’an is a seller’s market, the real-estate developers have no impetus to develop new technologies. Therefore, a suitable 3D modelling approach should be determined by considering the local circumstances.
Exploring the 2D-based method
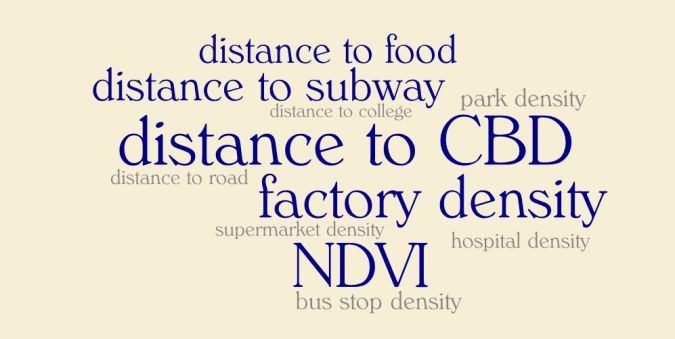
In this research project, first a regular hedonic price model with 2D indicators was applied. Generally, most research concluded that property price variations could be generalized by different statistical models. However, the R2 of 2D methods applied in this research, ordinary least squares (OLS) and geographically weighted regression (GWR) were too low to generalize a model (0.111 in OLS and 0.217 in GWR), which meant the models of current 2D indicators (Figure 1) could not explain the property price variations. The reason may be the use of first-hand property price data which was generated under the fixed-price and purchase-restriction policy established by the Xi’an municipal government, whose primary purpose was to stabilize property prices. Therefore, the prices may not show a significant impact from the geographical locations and surroundings.
The 3D modelling process and results
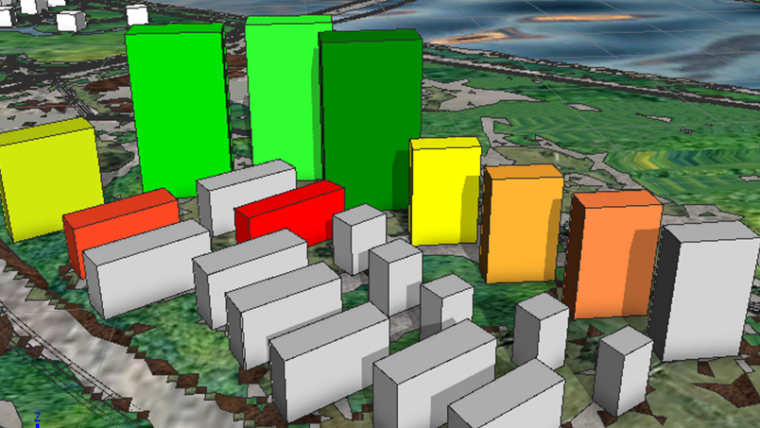
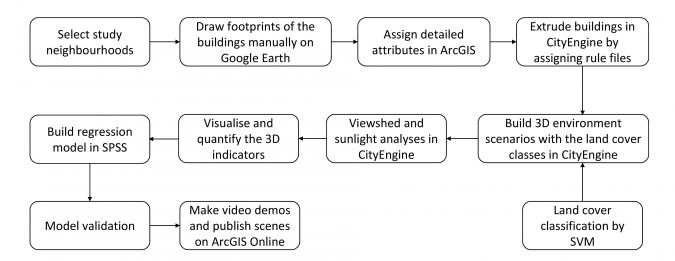
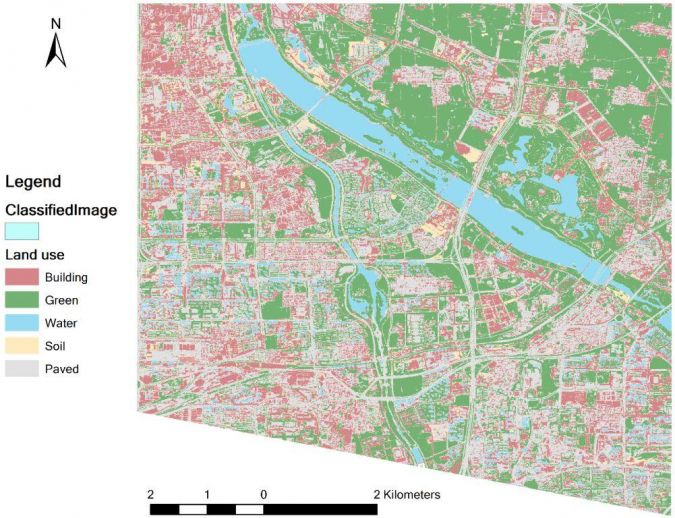
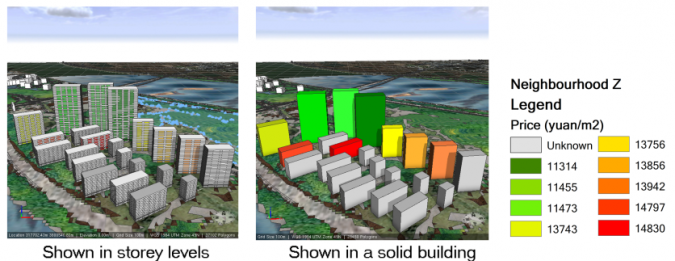
The preparation for a 3D model was divided into two main steps: land cover classification based on remote sensing data, and 3D data structure construction (Figure 2). The multispectral images used for the classification were from the Chinese satellite Gaofen-2, with a resolution of 4m, and Sentinel-2, with a resolution of 10m. The classification was executed by a support vector machine and validated by visual interpretation (Figure 3). 3D data structure construction was conducted in ArcGIS for creating height attributes for the 2D floor plans, which could be directly linked in CityEngine. In the 3D modelling process, two high-rise neighbourhoods were explored. The 3D indicators taken into consideration were view type, sky view factor (SVF), sunlight and property orientation. These were determined based on the local knowledge acquired by a questionnaire issued to Xi’an residents. The first three indicators were simulated by built-in functions in CityEngine: Viewshed and sunlight analysis. Property orientation was set up as a dummy variable. The regression results revealed that the R2 of the 3D method (0.451) was significantly higher than those of 2D methods. SVF, sunlight and property orientation were proven to have a significant influence on property price at 0.05 significance level. The findings disclosed that the 3D method could explain property price variations better than 2D methods. The 3D visualization in CityEngine also showed excellent performance regarding quantifying and analysing 3D indicators (Figure 4).
Validating the 3D model
The regression results of the 3D model were validated by leave-one-out cross-validation and the results turned out to be quite good, with a 9.76% error of predicting the property price. However, no research has ever set up a threshold or developed an approach for this kind of model validation. The analysis of the 3D indicators was all simulated in software and it would be time-consuming to collect them through fieldwork. Therefore, the validation of the 3D model will remain an important issue to be solved in the future.
A way forward
This research proved the 3D modelling approach, with its vivid visualization and powerful calculation, to be effective for high-quality property valuation. It shows a way forward in which property valuation can be conducted in a more comprehensive, precise and cost-effective way with high-resolution remote sensing data and 3D data structure support. Moreover, it can be widely implemented and adapted to other fields, e.g. for setting the price standards for future property tax in China. The researchers recommend more exploration in two aspects in particular. First, visualization and quantification of 3D indicators can be developed further. Accuracy can be improved with a higher LOD. Besides this, different calculation techniques may influence the research outputs, so it is necessary to develop an efficient method for quantifying 3D indicators. Second, this research contained a huge amount of manual work. Therefore, further exploration of automated techniques is recommended.
Acknowledgments
This work was supported by ITC and thanks are due to Dr Jong Wang and Dr Xia Li for data support.
Further Reading
3D scenarios of the neighbourhoods studied: http://bit.ly/2IEA3Wy / http://bit.ly/2Iyl4NJ

Value staying current with geomatics?
Stay on the map with our expertly curated newsletters.
We provide educational insights, industry updates, and inspiring stories to help you learn, grow, and reach your full potential in your field. Don't miss out - subscribe today and ensure you're always informed, educated, and inspired.
Choose your newsletter(s)


