3D point cloud aerotriangulation for smart city reconstruction
The search for optimal specifications to produce appropriate outputs
This study in Malaysia explores the use of sensor-acquired 3D point clouds as the basis for high-quality visualizations for the smart city subsurface.
3D city models are used as the underlying base for smart cities before being combined with other smart technologies such as building sensors, traffic control, street lighting and other advanced tools. 3D city models can be built using various spatial data acquisition techniques. Nevertheless, it is relatively challenging to acquire complete large-scale environment 3D spatial data using a single type of sensor because of limitations such as a single perspective view. Thus, the integration of different types of datasets or sensors is necessary. This article explains how the 3D point clouds produced from sensors are used as data input and processed using Bentley ContextCapture software, while testing the performance capability using various inputs. The study was conducted in three cities in Malaysia: Putrajaya, Shah Alam and Johor Bahru.
Aerotriangulation - a process for performing 3D reconstruction from photographs
Aerotriangulation is a process for performing 3D reconstruction from photographs. In other words, ground control coordinates are determined by photogrammetric means, thereby reducing the terrestrial survey work for photocontrol. The process identifies the accurate photogroup properties for each photogroup input, and computes the position and rotation of every image before the reconstruction process. Every image position and rotation is calculated from the metadata to be used in the reconstruction process. As each image is already in one component, the software automatically groups the images in the main component.
The reconstruction is defined by a few properties. First, a spatial framework that defines the spatial reference system, region of interest and tiling. Second, the reconstruction constraints that allow the use of existing 3D data to control the reconstruction and avoid reconstruction errors. Third, the reference 3D model, which acts as the reconstruction sandbox and stores a 3D model in native format, which is progressively completed as 3D model productions progress. Fourth, the processing settings that determine the geometric precision level and other reconstruction settings.
Aerotriangulation results
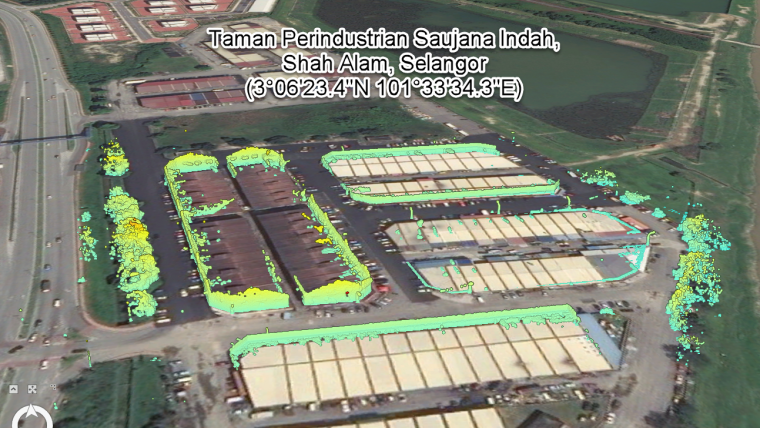
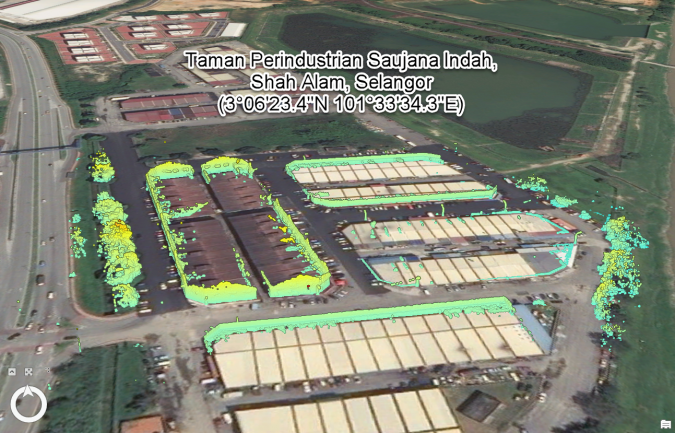
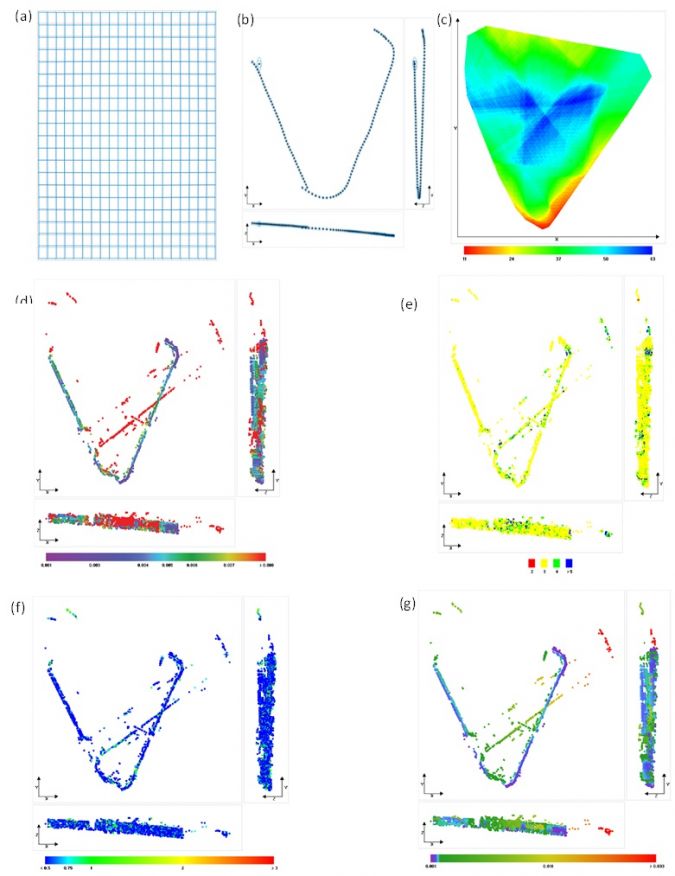
Figure 1 shows the area of Taman Perindustrian Saujana with the dataset acquired using mobile Lidar mapping and 360 cameras (Leica Pegasus). Around 337 MMS images were generated and used for this study. The total coverage area is 10,370.51km2 and the data size is 1.24GB. Most of the control points were entered manually, while some were imported from files to support accurate georeferencing and avoid long-range metric distortion images. An image can only be used in the aerotriangulation process if it consists of three or more control points, with each of the control points having two or more image measurements. In the aerotriangulation process in the camera calibration, grid distortion (Figure 2a), photo position uncertainty (Figure 2b), scene coverage (Figure 2c), tie point uncertainties (Figure 2d), number of images observing the tie points (Figure 2e), reprojection error (Figure 2f) and point resolution (Figure 2g) in the survey can be identified.
Produce the best visualization of 3D reconstruction
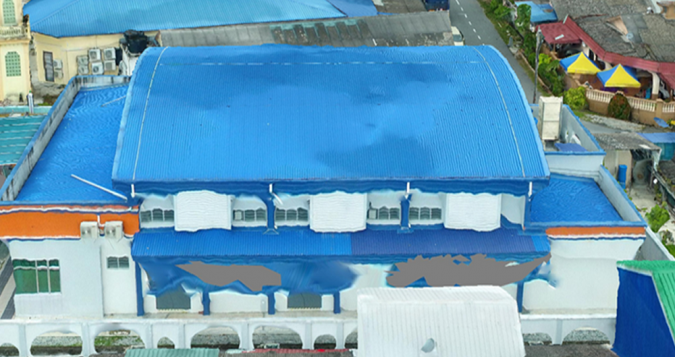
It took 37 minutes to complete the process. As the data size was low, no tiling was required to process the data since the expected memory usage to produce the model was 1.4GB and allowed extra precision in the processing mode. Since the data source used was based on MMS and low point cloud density, the best visualization could not be produced. Figure 3 shows the final output of the point cloud triangulation process. The 3D reconstruction results show several blank spots in the upper area of the building that need to be covered using other data, such as orthophoto or UAV images. To produce the best visualization of 3D reconstruction, it is best to combine several types of data from different sources, such as from orthophotos, aerial images and the point cloud.
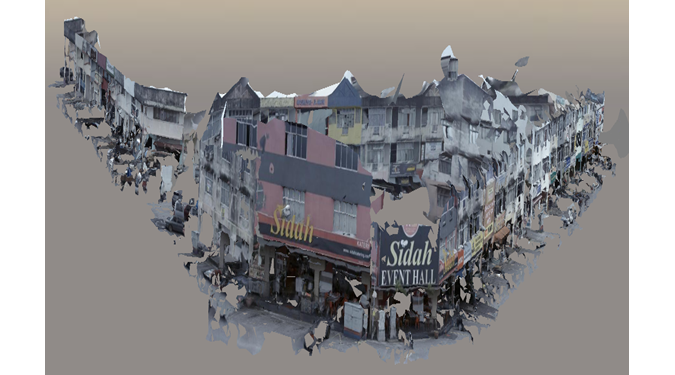
Another test was run on a different area located in Johor Bahru, this time focusing on a single building block – the building Dewan Muafakat, Taman Kobena. The coverage area is 1,168m2 and there are two types of data input utilized in this test, which are point clouds from TLS and aerial UAV images. The data size of the point clouds is 6.48GB, and the aerial image is 0.64GB. It took 16 hours for the process to produce the 3D reconstruction model. During the reconstruction process, adaptive tiling with extra precision processing was used. Figure 4 shows the final output of aerotriangulation. The result is much better than that for Taman Saujana Indah, as it has no hole and the upper part is mostly covered.
Monochrome orthomosaic images
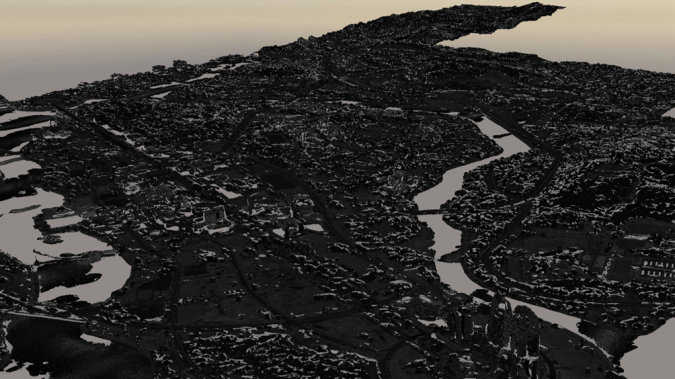
The aerotriangulation process was also tested on a larger area, in Putrajaya. The aerial image captured an area of 64km2 with a data size of 2.77GB, while the orthomosaic image recorded an area of 358km2 with a data size of 1.24GB. Overall, it took 23 hours to produce the output completely. Figure 5 shows the output of the aerotriangulation process for the Putrajaya area. The whole area is successfully constructed, including the water body. During the reconstruction process, adaptive tiling was used to adaptively subdivide reconstruction into boxes to meet the targeted memory usage. The tiling method is suitable for reconstructing a 3D model with highly non-uniform resolution data, such as aerial images and ground images. In such a case, it is not possible to find a regular grid size that is adequate for all areas. However, the minimum memory required by the software to process the data is 5.9GB. Since the data used in this test was monochrome orthomosaic images, the final output is shown in monochrome colour. To produce the best visualization for the output, a coloured orthophoto is needed with sufficient memory to avoid slowing down the process.
The challenges in performing the aerotriangulation process
The main challenge in performing the aerotriangulation process is the hardware, especially when dealing with large datasets. Furthermore, to obtain the best visualization, different types of data sources needed to be combined, such as point clouds and aerial images. To compare hardware performance, the data was processed using the same computer, with a Windows 10 64-bit operating system, Intel i7 processor, 16GB memory and NVIDIA GEOFORCE GTX850M graphics card, since the performance was tested in relation to the data size, memory, graphics card, tiling and processing mode.
Data size
The comparison of the data size is made between the different ground areas and the processing time. An extra precision processing mode was used for all the ground area sizes; however, no tiling was required for a ground area with a small scale. Nevertheless, adaptive tiling can be used for moderate and large ground areas. It took only 15 minutes for 3D reconstruction to finish the process for a small ground area (0.1346km²). Conversely, moderate (0.2456km²) and large (4.551km²) ground areas using adaptive tiling took 2 hours and 25 minutes and 6 hours and 12 minutes respectively to complete the process.
Computational memory
The processing time was compared between two memories and the amount of time for data processing to finish was recorded. In this test, data from Taman Perindustrian Saujana Indah was employed. This data used an extra precision processing mode since no tiling was needed. The processing time for 4GB memory of RAM and 16GB memory of RAM to finish processing the 3D mesh model was 15 minutes and 19 minutes respectively.
Graphics card
Using the same dataset, but this time with two different computers and graphic cards, each computer used an extra precision processing mode and adaptive tiling. The processing time for the NVIDIA GEOFORCE GTX 1070 was 2 hours and 25 minutes, while the NVIDIA GEOFORCE GTX 850M took 3 hours and 17 minutes.
Tiling
The large tile with an area of 51 metres with adaptive tiling took 4 hours and 46 minutes to process 102 tiles, whereas the moderate tile with a size of 25 metres took 6 hours to process 388 tiles. Conversely, the small tile with a size of 6.6 metres took 31 hours and 25 minutes to process. Both the moderate and small tile sizes used regular volumetric tiling.
Processing mode
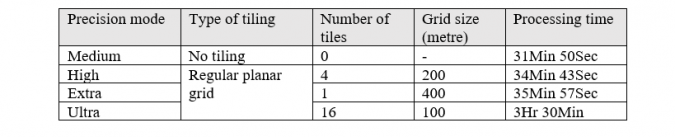
The next step was to process the same dataset with different levels of precision: medium, high, extra and ultra. Since no tiling was required for medium precision, it took just 31 minutes and 50 seconds to complete the process with 69% CPU usage. High precision used regular planar grid tiling to produce 4 tiles with 200 metres of grid size each and 70% CPU usage. This took 34 minutes and 43 seconds of processing time. Furthermore, extra precision also used regular planar grid tiling of 1 tile with a grid size of 400 metres, and ultra precision used 16 tiles with a grid size of 100 metres. Extra precision took 35 minutes and 57 seconds, while ultra precision took 3 hours and 30 minutes. The comparison is presented in Table 1.
Specifications recommendations for aerotriangulation processing
The following hardware specifications are suggested to ensure uninterrupted data processing. The Windows 64-bit operating system has a user-friendly environment and is highly compatible with various types of software. As for the processor, the latest Intel Core i9 is known for its capability to handle 3D modelling. However, the price of the Intel Core i7 is more economical, plus it can support complex processing and modelling. As for the memory, Windows 64-bit Intel Core i7 requires a minimum of 32GB to work well and storage that varies depending on the size of data; however, the remaining storage must be double the data size for optimal use. 64GB RAM allows smooth rendering for processing work and many studies have shown that the higher the RAM, the shorter the time to process the data. Lastly, the NVDIA Quadro P2000 graphics card is much slower than the NVDIA GeForce Series with the same functionality, and is suitable for various multipurpose computer workstations and mid-range rendering, CAD work and design.
Conclusion to produce a high-quality visualization for the smart city subsurface
Overall, explicit hardware specifications are required to produce a high-quality visualization for the smart city subsurface. This is to ensure that the data processing can run smoothly with few technical issues. Furthermore, the complement of suitable hardware and software is important for 3D reconstruction. Most of the software describes the minimum hardware requirement for installation but does not specify the effect of the hardware configuration during and after the software installation. Therefore, this study was conducted to determine the optimal specifications to produce outputs that are appropriate to current needs concerning the difference between the data size and study area.

Value staying current with geomatics?
Stay on the map with our expertly curated newsletters.
We provide educational insights, industry updates, and inspiring stories to help you learn, grow, and reach your full potential in your field. Don't miss out - subscribe today and ensure you're always informed, educated, and inspired.
Choose your newsletter(s)


