Automated Map Generalisation
Meeting Today's Information Demands
Nowadays spatial information is much more often displayed on digital devices than on a paper map. Within digital environments, users have high expectations regarding up-to-date information and consistent data when zooming in and out. The recent progress in automated map generalisation offers the potential to meet those high expectations.
‘Generalisation’ of geoinformation is the extraction of less-detailed data from highly detailed data to fit a specific purpose. Less-detailed data is more suitable for displaying geoinformation at small scales and for obtaining overview-like visualisations of a particular area. Interactive generalisation is time- and labour-intensive: it can take years to generalise a map at 1:50,000 scale from 1:10,000 data for a complete country. The automation of this process has therefore attracted considerable research interest over the past decades.
Automating the generalisation process
Since national mapping agencies (NMAs) traditionally produce maps at different scales, they have a high interest in automated generalisation, not only for traditional map production but nowadays increasingly to distribute multi-scale, on-demand maps within web-based environments. Automating a traditionally interactive generalisation process is not easy, since it is almost impossible to define automated generalisation rules that work for all situations. In addition, any interpretation that a cartographer can add in the generalisation process is hard to capture in code. For example, a cartographer could decide to slightly disregard the minimum size of buildings in favour of meeting a more important constraint such as non-overlapping features. It has proved to be extremely challenging to express all generalisation problems which heavily depend on the specific context in a way that can be understood by computers and to orchestrate the computation process accordingly.
From research to production
The gap between research and production in automated generalisation has been filled recently, and the results of sophisticated research on generalisation are being implemented in NMA production environments.
One example is the VectorMap District of Ordnance Survey in the United Kingdom (OSUK), which has been in production since 2010. Every six months, OSUK automatically generalises this map at district level (approximately at scale 1:25,000) from its master map without any human interaction.
In view of the increasing amount of digital information that places high demands on actuality of the data, NMAs are acknowledging the importance of automated generalisation now more than ever. Hence, they are investing significantly in developments, as was demonstrated at the ICA/EuroSDR workshop on this topic in 2013.
Huge advancements have also been made in commercial software, partly driven by collaboration projects between researchers, NMAs and software providers such as Esri. Such collaborations are important because algorithms alone do not define the generalisation problem – a major role is also played by data content, i.e. data models. This requires technology experts and data experts to work together closely. Another driver of the developments in automated generalisation has been a changing view of the problem: looking at the huge advantage automation gives in terms of rapid availability of up-to-date information, solutions no longer have to be perfect but rather must be good enough.
Case example: Kadaster, The Netherlands
Kadaster is legally obliged to produce topographic vector data and raster maps at scale 1:10,000, 1:50,000, 1:100,000, 1:250,000, 1:500,000 and 1:1,000,000 in an update cycle of two years or less. To meet this obligation Kadaster has been converting its vectorised maps into object-oriented databases since 2007. Cartographers used to generalise the small-scale maps interactively from the large-scale map. The maps at small scale were generalised in steps from the next-larger-scale map in a ladder approach. Consequently, a long process was involved in updating small-scale maps.
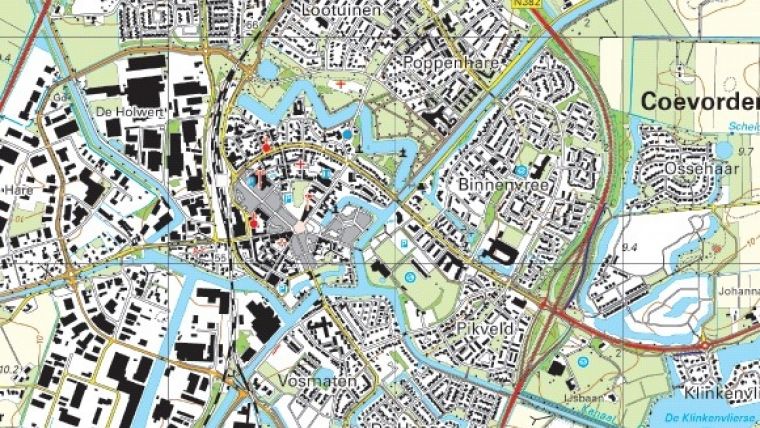
To improve efficiency, Kadaster initiated a feasibility study on automated generalisation in 2010. The study focused on the workflow from object-oriented 1:10,000 data (called TOP10NL) to a 1:50,000 map. Both source and target data cover the complete face of the Earth without gaps or overlaps. A sample of TOP10NL data is shown in Figure 1.
For map scales at approximately 1:50,000 and smaller, symbolised features appear bigger on the map than they are in reality. This results in intense competition for space on the map and requires more generalisation operations than smoothing and thinning. It requires enlargement, typification and displacement of features in an optimisation process which takes the priority of features into account.
Not aimed at replication
The aim of the automated generalisation workflow at Kadaster was not to replicate the existing map, for several reasons. Legacy topographic products may overemphasise past (cartographic) requirements and may ignore new requirements of multi-scale topographic information. Users may prefer up-to-date maps over maps that meet all traditional cartographic principles, although the results should still be of acceptable quality. In addition, automating a previously interactive process which was designed within a past technical and organisational context is not straightforward. Instead, Kadaster focused on solutions based on technological possibilities, combined with a willingness to reconsider the map specifications in case better results could be achieved.
Furthermore, Kadaster only accepted an automated generalisation solution that required no human interaction at all; it regarded that as the best guarantee for efficiency and consistency, and the only way to produce multiple on-demand products. For updates Kadaster preferred to completely replace the old version of the map and re-run the process, since maintaining links between different scales proved to be very difficult.
Users’ involvement
Since achieving user satisfaction was more important than matching existing map specifications, users were involved from the beginning.
In the feasibility study, existing generalisation guidelines for interactive generalisation were implemented in an automated process using the available tooling and some self-developed algorithms. User feedback was repeatedly heeded to refine and improve the process until the result was ‘good enough’ and the optimal sequence of steps, as well as the most appropriate algorithms and parameters, could be integrated into one automated workflow. The workflow consists of two main models for data thinning and symbolisation & displacement, i.e. cartographic conflict resolution, respectively. The two models contain over 200 sub-models to solve each specific context-dependent generalisation problem as necessary. One example is the removal of dead-end roads: they should not be removed if the dead-end road leads to a building that is kept in the process.
‘Good enough’ maps
Interestingly, the evaluations showed that users appreciated the ‘same appearance of the map’ less than ‘more frequent update cycles’. Indeed, they were willing to accept a ‘good’ map over a ‘perfect’ map, if that meant that updated 1:50,000 maps would be available two to four years sooner than is currently the case. In addition, the users were happy with the fact that the 1:50,000 maps would be 100% consistent with the 1:10,000 source data because of the synchronised releases. Some results of the automated generalisation were even valued higher than the results of interactive generalisation. For example, the automatically thinned road network appeared to be better for navigation than the interactively thinned road network, specifically for paths in forests. Finally, several respondents appreciated the improved uniformity of the whole map.
Software and technology
For the implementation, Kadaster is using a combination of standard ArcGIS tools, self-developed tools within Python and a series of FME tools. ArcGIS contains some specialised generalisation tools, e.g. collapsing two lanes of a road into a single road line, simplifying symbolised buildings and thinning of networks. In addition, the optimisation engine available since version 10 makes it possible to select the best generalisation solution out of interdependent generalisation rules. The complete generalisation workflow is implemented within the ArcGIS Model builder tool. Examples of other optimisation-based generalisation software available include 1Spatial’s Clarity (1Generalise) - which is being used in the aforementioned process of OSUK – and software developed by the University of Hannover and Axes Systems’ Axpand.
Entire country in 50 hours
To generalise a map for the whole of The Netherlands, the workflow is applied on about 460 generated partitions which were generated using linear objects that must never be displaced, i.e. highways and main roads. In contrast to map-sheet boundaries, such boundaries also appear in the real world and they do not clip features. Apart from some global operations that are applied for the whole country, the workflow is applied per partition and the partitions are subsequently connected.
The generalisation process of the 1:50,000 map from 1:10,000 source data for the whole country can be achieved in 50 hours in a parallel process running on six available systems that can generalise six partitions each (i.e. 36 partitions running at the same time). Figure 2a shows the 1:50,000 map that has been generalised fully automatically from the data shown in Figure 1. Figure 2b shows the interactively generalised version for comparison purposes.
Concluding remarks
Based on the results and positive user feedback, Kadaster decided to further develop the workflow in a production environment. The organisation believes that a fully automated generalisation workflow is the only sustainable workflow for the future, as well as the only way to produce products on demand. Including pre-processing, generalisation, visualisation and printing, the entire generalisation production turnaround is three weeks for the whole country. Therefore, a 1:50,000 update is scheduled with every new delivery of TOP10NL, which is five times a year. This is a significant improvement on the two-year period required for the interactive generalisation process – which in practice turned out to take five or six years in total.
The automated generalisation approach is currently being extended to the 1:100,000 map and to on-demand products, such as the backdrop map at multiple (15) scales for the national geoportal. In addition, the intention is to generalise TOP10NL from the 1:1,000 data collected by organisations that need to maintain public spaces such as municipalities, railway companies and provinces.
Image captions
Figure 1, Source data (1:10,000) in the generalisation process of Kadaster.
Figure 2, A 1:50,000 map, obtained fully automatically (A),and a 1:50,000 map, interactively generalised (B).
References
- Burghardt, Dirk, Duchene, Cécile, Mackaness, William (Eds.), 2014, Abstracting Geographic Information in a Data Rich World: Methodologies and Applications of Map Generalisation, Springer-Verlag GmbH, Heidelberg, Germany, ISBN 978-3-319-00203-3
- EuroSDR, Jantien Stoter, Blanca Baella, Connie Blok, Dirk Burghardt, Cécile Duchêne, Maria Pla, Nicolas Regnauld and Guillaume Touya, 2010, State-of-the art of Automated Generalisation in Commercial Software, EuroSDR, March 2010, 231 p.
- ICA/EuroSDR workshop on Designing Multi-scale Databases: Sharing Experience between Governmental Mapping Agencies, 21-22 March 2013
- Stoter, J.E., M. Post, V. van Altena, R. Nijhuis and B. Bruns, 2014, Fully Automated Generalisation of a 1:50k Map from 1:10k Data, in Cartography and Geographic Information Science, Volume 41, Issue 1, January 2014, pp 1-13
- Stoter, J.E., J. van Smaalen, N. Bakker, P. Hardy, 2009, Specifying
- Map Requirements for Automated Generalisation of Topographic Data, The
- Cartographic Journal,Vol. 46, No. 3, August 2009, pp. 214–227

Value staying current with geomatics?
Stay on the map with our expertly curated newsletters.
We provide educational insights, industry updates, and inspiring stories to help you learn, grow, and reach your full potential in your field. Don't miss out - subscribe today and ensure you're always informed, educated, and inspired.
Choose your newsletter(s)


