Big Data, Rising Tides
How Advances in Free Remote Sensing Technology Can Help Cities to Prepare for Climate Change
Combining big data with satellite imagery can help cities such as Kampala, the capital of Uganda, to better prepare for natural disasters such as urban flooding and make more informed investment decisions.
In view of the increased vulnerability of cities to climate and disaster risks, accurate and up-to-date geospatial data is fundamental for a more resilient urban planning approach. Publicly available geospatial datasets are increasingly becoming the foundation stone for more informed urban planning decision-making and better investment prioritization. Today, satellite data can help cities to better prepare for natural disasters such as urban flooding and make more informed investment decisions.
For many residents of Kampala, the capital of Uganda, the start of rainy season brings a sense of apprehension nowadays. Originally built on seven hills surrounded by wetlands, the city’s rapid growth has pushed settlements into flood-prone areas. Furthermore, extreme rainfall events now hit more frequently, as shown by destructive flash floods in May 2019. With the city’s water table saturated and drainage channels blocked, the flood waters blocked roads, entered houses and swept away livestock. More than 500 households were affected, according to the Uganda Red Cross. Some of the photographs that went viral locally showed a chicken farmer who saved his birds by putting 300 on the roof of the brooder.
As climate change makes its impact felt, Kampala is just one of hundreds of cities around the world whose leaders face a generational challenge due to increased flooding. Whether from heavy rains, coastal floods or the creeping impact of sea-level rise, restoring harmony between cities and water is a crucial task that requires the use of geospatial data at scale. Fortunately, cities are becoming increasingly data-rich environments. Flood and stream gauges help to monitor water levels within and around cities, climate and weather models are becoming more accurate in forecasting catastrophic flood events, and satellite and aerial imagery is becoming increasingly accessible and playing a vital role in monitoring the impact of flood events.
Big data for resilience
Between 1950 and 2019, the share of the world’s population living in urban areas rose from 30% to 55%, and the number of people living in such areas is likely to increase by a further 2.5 billion in the coming decades. By reducing trade costs and fostering innovation, cities have helped to lift hundreds of millions of people out of poverty in Africa and Asia. Yet the very agglomeration effects that make cities such powerful engines of economic progress also present a cost: the increasing concentration of people, buildings and infrastructure in high-risk coastal areas. It is estimated that up to 325 million extremely poor people will be living in the 49 most hazard-prone countries by 2030, particularly in South Asia and sub-Saharan Africa. Unplanned settlements, inadequate drainage investments and challenges with solid waste disposal add to the problem.

Adapting today’s cities to climate change requires addressing many pieces of a jigsaw puzzle: from investing in drainage and transportation to communicating early warning messages to vulnerable communities. But while their exposure to flood risk continues to grow, cities are also fast becoming data-rich environments. Internet-derived data together with satellite imagery offers a well-developed set of options to understand flood risk, shape policies to reduce it and prioritize investments in drainage and flood defences.
Satellite imagery: 3 ways to understand cities
In the past, expensive satellite imagery and limited computational power only allowed analysis of small geographical areas, e.g. the ability to count building footprints in a small neighbourhood or calculate the volume of live vegetation in a single agriculture field. This model is now being replaced thanks to publicly available and free satellite data that captures every location on Earth every few days and in a spatial resolution of just a few metres. Indeed, the increasing availability of satellite data has transformed how we use remote sensing analytics to understand, monitor and achieve sustainable development goals. As satellite data become ever-more accessible and frequent, it is now possible not only to better understand how Earth is changing, but also to utilize these insights to improve decision-making, guide policymaking, deliver services and promote better-informed governance, e.g. to help diagnose an issue of concern – such as flooding – and inform debate on remedial steps.
In the run-up to an investment planning conference convened by the World Bank’s City Resilience Program, which would be attended by around 30 cities, the Global Facility for Disaster Reduction and Recovery (GFDRR) and New Light Technologies Inc. utilized free satellite imagery together with machine learning approaches to address the following three questions:
Question 1: Which parts of the city experience flooding?
Flood risk assessment is a mature and long-standing field. Flood modellers typically use digital elevation models (DEMs) and local rainfall data to identify flood zones (e.g. the area of a city expected to flood during a 1-in-50-year event). Traditional flood models built with engineering expertise are indispensable when designing a flood mitigation plan. Yet hydrological models often miss areas that experience persistent flood problems. Blocked drainage channels, new construction and changes in vegetation cover all influence the interaction of water with the urban fabric. Many residents in developing-world cities lose possessions or experience health impacts from flooding, even where flood maps show them in a dry zone.
Thanks to the EU’s Copernicus mission in particular, the availability of free satellite imagery that can capture snapshots of actually experienced flooding is increasing. Sentinel-1 imagery relies on Synthetic Aperture Radar (SAR) – a radar sensor that is capable of detecting flood extents regardless of cloud cover – while Sentinel-2 provides high-resolution electro-optical imagery which can capture water content on Earth.
To supplement existing flood models, the research team mapped each major flood event that had occurred across 35 cities since 2015 and for which imagery was available. The identified flood extents show areas that have been affected by standing water in each city and that are thus more vulnerable to urban flooding.
Question 2: Which city zones are the focus of economic growth?
Night-time light data has produced a slew of academic studies since the 1990s, with the intensity of artificial lights – as seen from space – proving to be closely correlated with gross domestic product (GDP). Economists have used DMSP-OLS, a key imagery source from the USA’s Defense Meteorological Satellite Program, to estimate, for example, economic trends in North Korea or to monitor economic development in countries where GDP figures are scarce or, in some case, unreliable. But while DMSP-OLS allows time-series comparisons since 1992, its resolution is relatively coarse and additional processing is required to mitigate a ‘blooming’ effect around urban areas or to make DMSP-OLS’s eight satellites comparable.
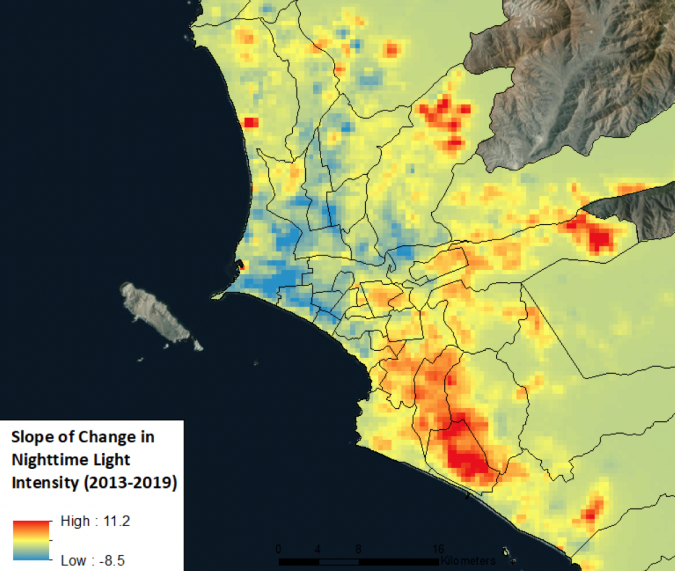
Analysts can now utilize a higher-resolution source for night-time light data: the Visible Infrared Imaging Radiometer Suite (VIIRS), which captures imagery at up to 500m resolution. This means that it is now also possible to estimate spatial trends in economic activity down to the neighbourhood level. The research team used a slope-of-change method to identify economic growth trends and hotspots since 2012, marking high-growth city districts as ‘hot’ and areas of steady or declining economic activity as ‘cool’.
Question 3: Which areas in the cities have green spaces that could absorb more flood water?
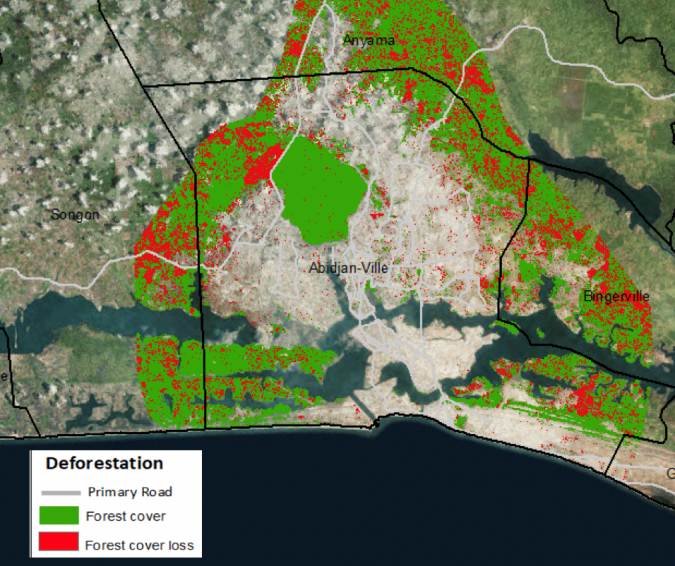
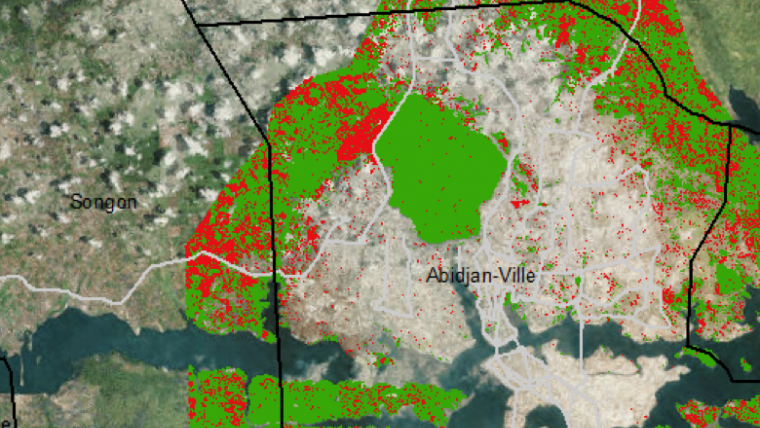
The high-resolution imagery captured by Sentinel-2 allows for systematic extraction of open spaces, parks and gardens in urban settings. The widely used Normalized Difference Vegetation Index (NDVI) effectively picks out vegetation from multispectral imagery, benefiting from the unique reflective properties of chlorophyll. Additionally, the research team used analytical products derived from Landsat satellites to pick out areas that show extensive trends of deforestation. This enables suggestions regarding locations where reforestation in a city’s watershed could contribute to preventing excess run-off that floods businesses and neighbourhoods, for example.

Network effects
Just as analysis of satellite data is no longer limited to researchers with government connections or super-computers, the field of road network analysis is also being democratized by new technologies. Shortest-path analysis and routing engines have for decades been used by logistics firms to plan their vehicle itineraries or by emergency services to position their assets. Yet building a GIS road network remained onerous and time-consuming. Moreover, ‘hidden choices’ about how to represent city streets or intersections in the model have hampered cross-city comparisons.
So how can we compare road networks across 35 cities? Fortunately, data science tools such as OSMNx and Pandana – two open-source packages produced by researchers from the universities of Southern California and Berkeley respectively – have automated the process of importing road data from OpenStreetMap and transforming it into a mathematically valid graph object. This allowed the project team to pinpoint the most critical intersections that should be safeguarded from risks such as flooding and landslides. Criticality was highest in cities such as Cap-Haitien, Haiti, where 58% of shortest paths between network locations pass through a single point (a bridge at the north end of town).
Conclusion: from data to decisions
The availability of high(er)-resolution satellite imagery such as Sentinel and VIIRS at global scale begs further exploitation. Indeed, cities are becoming data-rich environments just as their vulnerability to climate change grows. Deriving more insights from free and currently under-exploited imagery sources can play a major role in driving the policy debates and investment choices that will enable cities to withstand natural hazards and climate change in the future.
Acknowledgments
The research team included Brad Bottoms, Jenny Mannix, Madeline Jones and Brooke Hatcher (New Light Technologies Inc.) and Gaurav Bhardwaj (World Bank).

Value staying current with geomatics?
Stay on the map with our expertly curated newsletters.
We provide educational insights, industry updates, and inspiring stories to help you learn, grow, and reach your full potential in your field. Don't miss out - subscribe today and ensure you're always informed, educated, and inspired.
Choose your newsletter(s)


