Capturing the Arctic and Antarctic
Insight into some intriguing polar mapping projects
Capturing and measuring the environment in the Arctic and Antarctic is a particularly challenging job. The area of interest is often covered by a thick blanket of snow and ice, while extreme temperatures can be dangerous for both the surveyor and the equipment, plus strong winds and bright sunshine can further hinder the work. However, it is essential to map these parts of our world as their future is under pressure, not least due to climate change. This article provides an overview of some recent adventurous surveying projects and applications in some of the coldest regions on our planet – from mapping penguins to monitoring icebergs using UAVs, and from mapping the impact of global warming on the Greenland Ice Sheet to creating a digital twin of Antarctica.
Advancements in technology for observing and capturing details about the Earth have opened the door for new projects to enlarge our knowledge of remote and inhospitable areas, and the Arctic and Antarctic are prime examples. These regions are popular locations for a wide variety of research projects that observe and monitor the environment. When mapping habitats, field-based studies are combined with geospatial data for analysis and modelling purposes. Remote sensing methods play an important role in studying the dynamics of glaciers and ice sheets. Meanwhile, mapping of the seafloor of the polar seas has gained momentum, not least thanks to the rapid pace of development in sensor miniaturization and autonomous mapping.
Mapping penguins in Antarctica
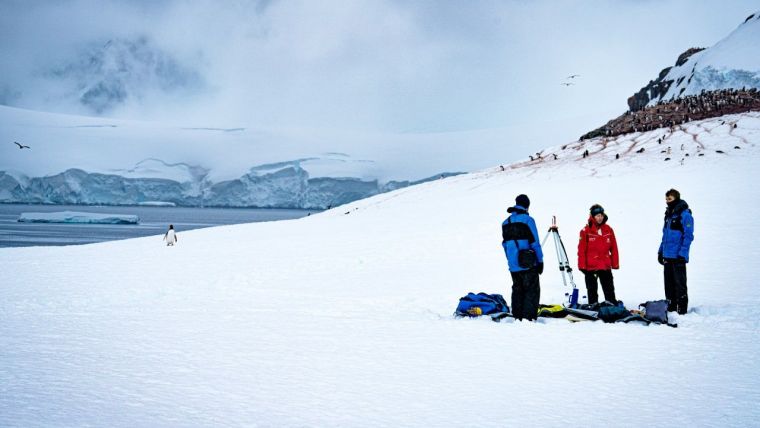
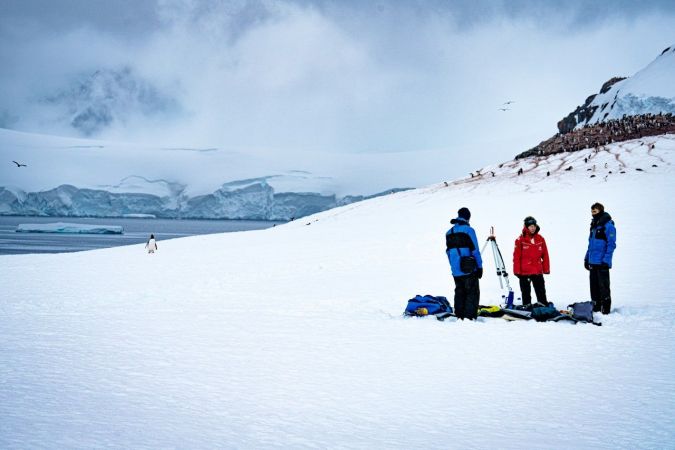
In Antarctica, student researcher Lana Lenourry has been on a mission to map the breeding sites of penguins. This project was part of the Antarctique 2.0°C Expedition, which is an interdisciplinary study on climate change and humankind’s environmental footprint. Phenomena such as sea level rise and glacier retreat due to climate change are likely to affect the habitat of Antarctica’s penguins. Understanding how penguins occupy the space today will make it easier to anticipate which changes they will face. Analysing the spatial distribution of the different penguin species helps to determine nesting trends according to the species studied and consequently to highlight potential competition for access to breeding space.
For the survey to map penguin colonies, a YellowScan Mapper was loaded on a DJI Matrice 300 unmanned aerial vehicle (UAV or ‘drone’) while flying at 60m altitude at 10m/s. The system was able to map all types of terrain in the area, ranging from dry to snowy to soggy. The temperature was between -5°C and 5°C in the peninsula as the project took place in the Antarctic summer, so the cold was not a problem. However, the weather was unpredictable and changed rapidly. Some flights had to be carried out while it was snowing. Wind was also a risk factor; some of the missions had to be postponed and even abandoned because of the wind speed. These challenging climate conditions were intensified by time pressure; the team only had one day per site, making it necessary for them to quickly come up with an effective process to map and identify all the penguin species present in the area.
The YellowScan Mapper was equipped with a camera module, enabling the selection of flight parameters for photogrammetry purposes. The base station for the geolocation by satellite was provided by Teria. Lenourry had received some training from Instadrone and YellowScan to prepare her for UAV mapping, but as a non-experienced pilot she soon discovered how difficult it can be to access a site. The transport cases provided to move the equipment (especially the UAV) were not at all adapted for the Antarctic terrain, which involved landing from the sea and moving in several inches of snow. Ultimately, the team members had to strap the transport cases on their backs, which was a considerable drain on their energy resources.
Since Antarctica is among the most poorly mapped places on Earth, it was difficult to prepare for the mission in advance due to the lack of access to accurate, high-resolution maps. Moreover, the crew had no internet access in the field. The combination of the YellowScan Mapper and the Matrice 300 UAV proved to be a reliable and effective solution in these demanding circumstances. The UAV flights resulted in digital elevation models (DEMs) that enabled the penguins and their nesting areas to be identified and mapped in each zone to analyse their segregation.
Monitoring iceberg melt with aerial and underwater drones
An iceberg is a floating mass of ice that has broken off a glacier or an ice sheet. They can often float around for a number of years. Climate change is accelerating the glacier retreat, which is leading to an increase in the number of icebergs. In the Northern Hemisphere, thousands of them are formed each year along Greenland’s west coast. These often drift southwards to Newfoundland with the cold Labrador Current. In the seas around Antarctica, they drift northwards, ending up in the sea between South Africa and South America where the water is warmer, causing the ice to melt quickly.
As icebergs melt, they release freshwater into salty ocean waters, which has a significant impact on local circulation. To gain a better understanding of how global circulation will change in the future, it is crucial to accurately map iceberg melt rates. In recent years, UAVs have proven to be a useful tool for this task, provided that they are properly equipped.
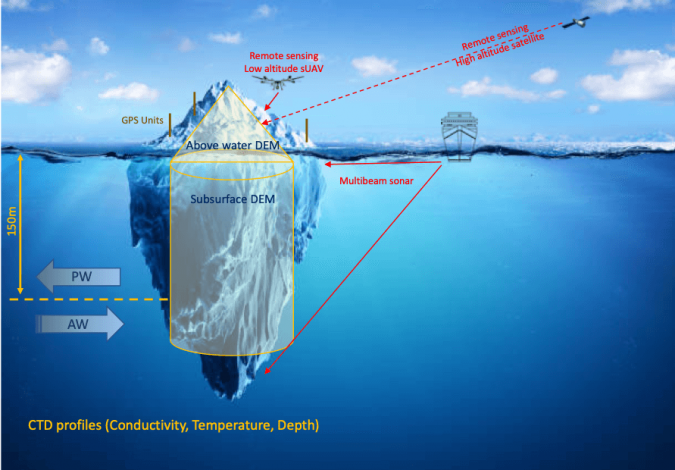
The geospatial data that is acquired by the UAV from above the iceberg is used to create a dense point cloud and a surface mesh. Since the iceberg is in motion during the survey, the geodetic GPS positions are used to correct the gaps in order to construct the point cloud. The surface DEM can then be used to predict the volume of the tip of the iceberg. However, in order to get a clear picture of the iceberg situated below the water – which often accounts for 90% of the total mass – this is combined with data derived from multibeam sonar-equipped subsurface vehicles to create a subsurface DEM. This process results in a full 3D model of the whole iceberg.
Mapping the Greenland Ice Sheet
The Greenland Ice Sheet is a vast mass of ice covering an area of approximately 1.7 million square kilometres, which is around 80% of the whole of Greenland. It is the second largest ice mass in the world, after the Antarctic Ice Sheet. Its average thickness is more than 2 kilometres, and the ice is more than 3 kilometres thick at the thickest point. However, in 2012, the top layer of the land ice on Greenland had melted so quickly during the summer that NASA researchers at first thought there was something wrong with the satellite imagery. Ice drilling results show that such rapid melting occurs once every 150 years, but then in 2019 it happened again. To better understand this worrying situation, researchers from the Department of Geoscience at the University of Fribourg, Switzerland, are using drones to map the melt-prone areas of the ice sheet. The project is still in full swing.
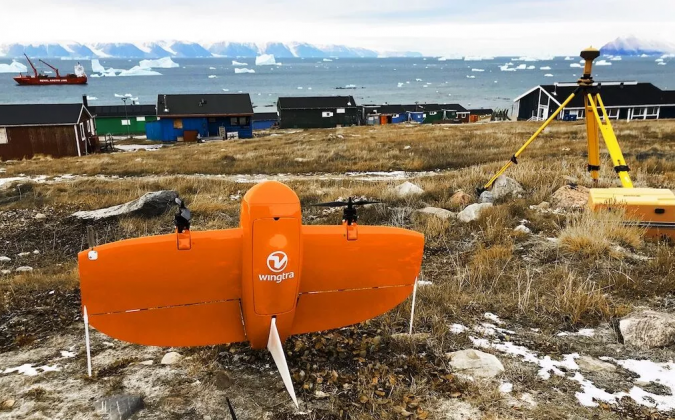
The research team has chosen to use the WingtraOne UAV, equipped with a MicaSense RedEdge-MX multispectral camera. The WingtraOne has proven itself during a multitude of projects under harsh conditions. In Alaska, the Swiss-engineered UAV has been used for mapping glacier changes as well as for avalanche risk inspection and permafrost monitoring. Greenland is similar to Alaska in terms of having large areas that are complicated to map due to challenging wind vectors. The vertical take-off and landing (VTOL) fixed-wing capabilities make this UAV a safer choice and enable the project team to fly at an altitude of about 400m (1,300ft) above the ice to gather data. Moreover, solutions such as the WingtraOne are particularly suitable as they are able to reach high levels of location accuracy without the need for extensive ground control, facilitated through the integrated multi-frequency PPK module.
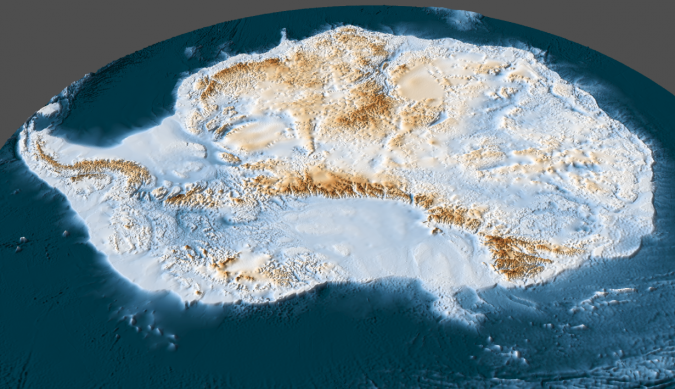
Digital twin of Antarctica
Digital twins of buildings, cities or even entire countries are becoming increasingly commonplace, so why shouldn’t it be possible to create a digital version of a whole continent? And there are several initiatives that are attempting to do just that for Antarctica. The most prominent one is the 4D Antarctica project, which is aimed at advancing the understanding of the Antarctic Ice Sheet’s supra and sub-glacial hydrology, its evolution, and its role within the broader ice sheet and ocean systems. The ambition is to create a dataset composed of icesheet-wide hydrology and lithospheric products, Earth observation (EO) datasets as well as a state-of-the-art ice-sheet and hydrology model to gain a full understanding of Antarctica and its dynamics. The numerous project partners include British Antarctic Survey (BAS), The University of Edinburgh, Technical University of Denmark (DTU), ETH Zürich and the German Aerospace Center (DLR).
As Noel Gourmelen from the University of Edinburgh explained it to ESA: “By harnessing satellite observations, numerical simulations and artificial intelligence, we have built a twin of the Antarctic ice sheet system, its hydrology, surrounding ocean, atmosphere and biosphere. We have used the Antarctic twin to track the whereabouts of melt water on and under the ice sheet, and to explore how fringing ice shelves melt under various hydrology scenarios.”
Machine learning and artificial intelligence are being leveraged in order to get the most out of the complex information that is available. As Professor Amos Storkey from the School of Informatics at the University of Edinburgh added: “It is all about learning how to best piece together the current sources of knowledge to provide greater clarity about what we can know and good measures of what we don’t.”
In another similar initiative on the Earth’s southernmost continent, the Australian Antarctic Division has announced its ambition to develop a digital twin of East Antarctica (also called Greater Antarctica), which makes up the majority of the Antarctic continent. This project is still in an early phase, but there are reports of plans to use drone fleets to map inaccessible areas and an Antarctic ‘eye’ with integrated sensors and cameras feeding back real-time information.

Value staying current with geomatics?
Stay on the map with our expertly curated newsletters.
We provide educational insights, industry updates, and inspiring stories to help you learn, grow, and reach your full potential in your field. Don't miss out - subscribe today and ensure you're always informed, educated, and inspired.
Choose your newsletter(s)


