Cartography as a Tool for Geospatial Decision Support
GIM International Interviews Ferjan Ormeling
From 25 to 30 August 2013, the 26th International Cartographic Conference was being held in Dresden, Germany, bringing together cartographers and geographic information science specialists from across the globe. In recognition of the importance of the study and practice of mapmaking, GIM International had devoted its August 2013 issue to this event, so it was particularly fitting to feature an interview with Ferjan Ormeling, the prominent Dutch cartographer. Covering cartographic challenges, the power of maps, and lessons that can be learned from the past, Ormeling's views are that of an inspired and inspirational proclaimer of his specialist field.
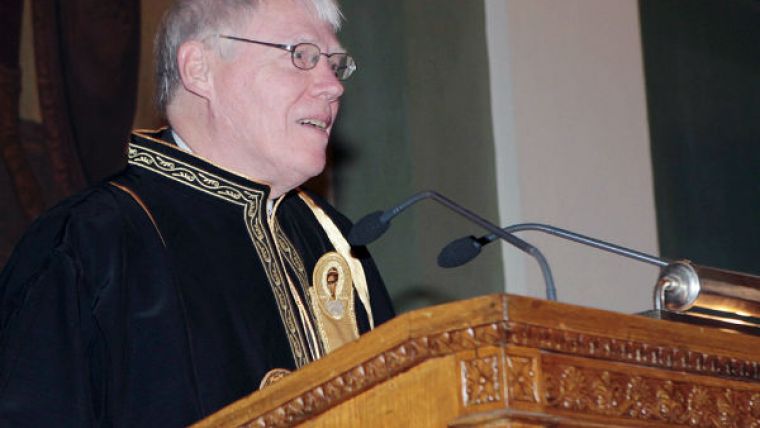
In May 2013 you were awarded a Professor et Doctor Honoris Causa degree in cartography from Eötvös Lorand University (ELTE) in Budapest, Hungary. Congratulations. How did that feel?
Well – and I think this is a standard reaction of most Doctores Honoris Causa – since it came completely out of the blue, my first reaction was astonishment. But I really feel honoured with this distinction. I am proud to have received this title, especially from ELTE. There are very few Doctores Honoris Causa in cartography, so I regard this really as a tribute to the profession. It also shows an academic acceptance of the profession.
Could you tell me a bit more about your career as a cartographer?
When I was a child, my father was director of the Geography Institute for the topographic survey of the Netherlands East Indies. Hence, much of my childhood was spent walking through the premises of that institute, experimenting with the optical pantograph and playing hide and seek between the large cardboard models of volcanoes in the corridor. So as you can see, working with maps came quite naturally to me.
As a student I studied for a degree in geography at Groningen University in The Netherlands. During that time I worked part-time as an assistant atlas editor with Wolters Publishing House. I spent eight years employed by Wolters, working on the Bosatlas.
When I graduated, my initial idea was to land a job as cartographer for an oil company. Cartography was not offered at Groningen so I travelled to Utrecht once a week where professor Koeman lectured in cartography. In Groningen, I also studied Arabic. Armed with this combination, I thought I would be the ideal candidate for Aramco to hire for map production. But things turned out differently: I never realised my idea. Instead, I was hired by Utrecht University to help shape the new cartography education programme, and I have been there ever since.
One of your special interests is the history of cartography. What intrigues you about the past and what can today’s cartographers learn from it?
Well, I’m a recent convert to the history of cartography. Up until I retired, I taught the many different aspects of modern cartography and hardly spent any time on its history because my immediate colleague Günter Schilder was teaching that. Since my retirement, I’ve joined his research group, Explokart, which is now chaired by Peter van der Krogt, and moved with them to Amsterdam University. I think as a cartographer you must know about the past; you can’t be a really good cartographer unless you realise how spatial information was transferred in the past. When you look at old maps, it is clearly apparent that they were really social constructs. It is society that orders maps, and not cartographers themselves – society decides on the contents of maps. This helps to give you a better understanding of spatial information transfer in the present.
Another area of interest is toponymy, the study of place names. What is it about toponymy that fascinates you so much?
Around 1980, I was asked to join a conference about place names in Bozen, in Italian Bolzano. While I was there, I realised that South Tirol had been a German-speaking area for a thousand years. In 1919 the Italian army came in, changed the name signs of the towns and villages – and even tried to the change the citizens’ surnames – and produced maps which made the area look completely different from previously. Even the Italians themselves had produced maps of Southern Tirol before the First World War showing only German names, and then all of a sudden in 1919 they translated all the names, Italianised them, which made the area look completely different on the map. This was an eye-opener for me about the power of maps. Just by manipulating the content, i.e. the names, they made look the area completely Italian. Looked at the new map, the logical reaction would be: ‘Of course this should be a part of Italy, just look at the names!’
Then I used this as the subject of a PhD thesis examining the way national mapping agencies in Western Europe dealt with minority names. I studied the processes through which names from minorities where adapted to the official language. It turned out that in a number of countries, especially in Scandinavia, the authorities were very accommodating to the minorities. That was not the case in most of Central and Southern Europe at that time. Even in The Netherlands, topographers tended to translate names used by the Frisian minority, with some pretty odd mistranslations as a consequence. Things have changed since then, and Frisian names are now used on the map wherever the local authorities want to use them. And presently, thanks to increased interest in cultural heritage, this attitude is accepted all over Europe.
You have been part of UNGEGN. Could you tell me a bit more about this group and about its importance?
When I joined in 1980, the group was already well underway; UNGEGN was established back in 1959. At that time the main purpose was ‘univocity’, the need for having one name for every specific topographical object. And for univocity you first need national standardisation before international standardisation can be considered. The latter requires the acceptance of specific conversion systems from one writing system to another, for instance.
UNGEGN is a group of about 300 cartographers and linguistic scientists who convene about three times every five years, in order to promote this standardisation. We are devising training for collecting and processing the names in order to standardise them, we come up with criteria that names have to meet before they can be implemented on the map. We come up with essential attribute information – for instance, questions like: is the name plural or not, is it feminine or masculine, is definite or indefinite? Information like that has to be collected in a standardised way. If you want to use these names, whether on maps, in route information systems, on name servers or in gazetteers, all these aspects have to be dealt with uniformly.
Initially UNGEGN was only for the production of maps and its members were mostly cartographers. But with the increased possibilities for linking data files and using names for geoparsing and related techniques, it has become an essential aspect of the spatial data infrastructure. That’s why we are also participating in UNGGIM. UNSTAT, which is in charge of UNGEGN, is now also behind the UNGGIM initiative. We have to cooperate with UNGGIM and to convince them of how essential standardised geographical names are.
Of all the cartographic work you have produced, what are you most proud of, and why?
What I like most is the biography of the principal Dutch school atlas, Bosatlas, which has been published in consecutive editions since 1877. This really was fun to do because I could combine my love of atlases and my interest in their development with my own experience – and this was particularly personal because my father was one of its former editors so I could describe what he had contributed to the atlas. He returned to The Netherlands in 1956 after leading part of the topographic survey of the Dutch East Indies and later of Indonesia, as he was asked to stay on after Indonesia gained independence. He modernised the Bosatlas because it had become a bit out of date by then. So that project allowed me to include a bit of family history, but most of all it was a joy to look at all the maps from all the – at that time – 53 editions and to see how they had changed over time in terms of content, style, purpose, etc.
Do you wish you could redo any of the cartographic work you have been linked to?
Well, when I look at some of the editions of the Bosatlas, and at the maps that I drew for those editions… with hindsight, I think I could have done a lot better. Especially after having trained students in producing correct maps for 30 years, I can now see that I made a lot of mistakes in those early days. But the training I had at Wolters was focused more on manual dexterity than on editorial and editing aspects; when I first started there in 1961, I had to spend one evening a week at the house of the chief of the drafting office, Mr Bus, to practise lettering. I had to draw letters over and over again until they all looked completely alike, in order to be able to manually letter the maps I produced. Those are the maps that I would really like to redo.
Does the quote from your 1986 inaugural address still apply: “The description of the maps [produced for parliament] is a litany, a series of cartographic mistakes, misunderstandings and ignorance?” And if so, why?
I had been nominated as professor of cartography in 1985 and for my inaugural address I did a survey of all the maps produced by the government. I focused on the maps produced for the Dutch parliament, and they really were bad. For instance, members of parliament were asked to vote on the construction of a new coal plant near Rotterdam. To help them decide, they were given a map drawn on an index sheet of a topographic map series. On each square of the index sheet, the numbers indicated the tons of SO2 emissions already present. The members of parliament were supposed to get an idea of the emission levels just from looking at those numbers. This made no sense at all (see Figures). Things have improved since, and the situation is far better nowadays with cartographers in charge of spatial information transfer.
A lot has changed since 1986. One major development is that the use of internet has exploded in the past decade. Google Earth and other Earth viewers are available to millions, if not billions of people. As a consequence, graphical communication is becoming increasingly important. How do you see cartography adapting to these technological developments?
I see two challenges: one is that we are producing imagery that does not take into account the size of the monitors that are used. Yet the size of the monitor determines whether we have an overview or not. In most cases it is very difficult to gain an overview using handheld devices, and that is a real problem. You can have an overall image or you can zoom in; once you’ve zoomed in, the overall image is lost, making it difficult to get one’s bearings. That is a problem that we haven’t really been able to solve yet. Cartography is not only about producing maps, but cartography is also about reading and understanding maps. The other challenge is that we have not yet been able to teach society to use the new imagery properly. This is a major issue, which I also addressed in the speech I gave in Budapest when I accepted the honorary doctorate. In cartography, we distort intentionally because we know that it’s only by distorting images that we can give the correct impression. In my Budapest presentation, I quoted the Swiss painter Paul Klee who said, “Artists do not render reality, they make it visible”. I think cartographers do the same; in other words, by distorting reality you can make it visible. Cartography is democratised now, enabling anyone to produce maps, but cartographers have not sufficiently shared their knowledge of map distortion for better spatial data communication.
Maps are increasingly being replaced by 3D models, to represent cities at different levels of detail, for example, from digital elevation models up to the interior of buildings. What do these developments mean for cartography?
They show the value of cartography. The main problem of 3D imagery in cityscapes is that it makes them so hard to interpret. You get an overload of information; people would much rather have a more simplified version in order to be able to process it. The message here is: learn from how cartographers have for centuries been generalising maps in order to present the amount of information that one needs for a specific task. In 3D cityscapes, I often feel as if I’m drowning because of the overload of information. On the other hand, I do realise that, because maps are abstractions of reality, it’s difficult for many potential users to relate to them. 3D representations help people to overcome this abstraction aspect.
There is one other thing that we cartographers have not been able to do yet, which is something that I like a lot in games such as SimCity. As soon as you build a road or an airfield within the game, cars will start driving over the road and you will see planes landing at your airport – this really helps to overcome the abstraction facet. I’m surprised that we cartographers have not been able to come up with this in digital cartography in order to populate our maps with cars, planes, boats or even with people.
Last year, I did a study of the old maps of Amsterdam, such as the first panoramic maps that were produced of the city in the 16th and 17th century. If you look at them with a magnifying glass you can see all kinds of tiny images – of people walking around, loading cargos or rowing boats on the canals. These images help to overcome the abstraction.
Esri is just one of the companies making maps available to a wider audience via cloud services. What is your view on such cloud services?
Of course, these maps are still in English, so that may pose some problems for non-English speakers. In The Netherlands, we are also seeing that our toponymy is becoming increasingly anglicised. Dutch newspapers will use the term ‘Baltic’ instead of the Dutch name Oostzee (‘East Sea’) which is the correct Dutch term for the Baltic Sea. This is often a case of journalists having no idea about correct geographical names and just copying them from news servers. That is one aspect of using the maps that Esri provides. Otherwise, it still is a great service, but one has to be aware that it should be adapted for national use. Versions in the native national languages are necessary.
Esri did not used to be interested in that aspect at all, but lately the company has learned a lot about proper map design and invested in it. In its way of both producing and programming, there is much more attention for the graphic aspects.
What do you expect will be the greatest cartographic challenges of this age?
To realise cartography’s potential for supporting geospatial decisions. I think the greatest challenge will be to put cartography as a tool at the forefront of global issues such as environmental protection. Since maps are such a strong medium that can pass on messages like no other medium can, they should be better harnessed to show how our environment is deteriorating, what the effects of climate change are, etc. Really, with the help of maps you can show that better than in any other way. When you see a series of maps showing the consecutive stages of deforestation in an area like Borneo, for instance, it has an enormous impact. This is how cartography can really assist in global issues.
Another challenge relates to the contribution of cartography to emergency mapping. Here, the challenge is to implement the spatial information derived from maps in all kind of emergency systems, like in route planners.
Within the framework of the United Nations Group of Experts on Geographical Names (UNGEGN), various studies are being done right now, especially in the field of geoparsing (the process that enables official documents to be scanned to find geographical names in them). When an event occurs at a location with a specific name, you can scan all documents and identify those in which that specific name is used. In this way, you can collect all the relevant data for that location. These techniques are now being harnessed for emergency mapping. Of course, this only works when the names are standardised and when there are not too many places with the same name. We did field work in Madagascar in June 2013 and there we found a specific place name which occurred 24 times in the same province. Imagine how difficult things would be if a disaster which required relief measures were to occur in one of those 24 places!
You have been active in the International Cartographic Association (ICA) for many years. In 1999, you were elected secretary-general and treasurer of ICA. How do you see the present role of ICA in today’s world, which is turbulent demographically, technologically and economically?
Back in 1999 people were still sending letters, so it was very good for my stamp collection to be secretary-general for eight years! I loved that time. I think the ICA is a bit different from the other international organisations in the mapping sciences, like FIG or ISPRS, in that it is very much a bottom-up organisation, that’s the way we operate. We have been able to show to our sister societies and UN institutions what we can do, how we can cooperate, and how we can contribute to global issues. That’s been the main role of ICA over in recent years. I think the current board members are doing really well in that respect; they are very successful at highlighting all the potential contributions of cartography. The ICA website is really a most accessible and convincing display of the kind of maps that can be produced to support global initiatives. I think we’re also doing quite well in terms of the number of participants at our conferences. It’s a very solvent organisation. ICA is also doing a lot for developing countries with its third-world policy and initiative for Africa: we are organising workshops in intermediate technology for developing countries. We’ve really been able to put ourselves on the map.
Imagine you were a young cartographer today at the start of your career – how would you see the future?
I would have been educated during a time in which the influence of spatial imagery of maps is ever-present. When you compare the journals of nowadays with the journals from the 1980s, today’s journals are full of maps, plus maps are shown on TV and there’s an enormous amount of maps on the web. Wherever you want to look for them, you will find maps. To be part of this provision of maps and to make sure that they are proper ones is a challenge that I would be keen to take on.
Because cartography has been democratised, there is also a lot of rubbish on the internet – badly produced maps. We used to have a special section in our Dutch cartography journal in which we reproduced a map taken from either a newspaper or a government publication that had been poorly produced. And then we put the proper, well-designed version next to it. It was the most popular section of the journal, maybe because we usually ‘attacked’ government publications.
To be aware that we have these tools and that they are frequently not used properly, and to show how things can be improved – that is a challenge that still would appeal to many young cartographers.
Attracting sufficient students is a major issue for geosciences and geomatics programmes at European universities. How is the situation in The Netherlands, and do you have any suggestions for increasing the geomatics student population at European universities?
I’m afraid I don’t have an answer to that. At Utrecht University, our cartography programme was one of the principal sufferers of the fact that student numbers have not so much been dropping, but rather have been unable to keep up with the continuing level of increase that is considered necessary by the Dutch education boards. As a country, we don’t need many cartographers a year, but we do need some. If there is a threshold, it means that you have to train more than 20 cartographers every year, otherwise your programme will be suppressed. Perhaps in the new Europe you are expected to say that students can just as easily go to Ghent or Hanover if they want to study cartography, but in view of the important cartographic heritage and tradition in The Netherlands and in the view of the fact that maps and mapping are linked to a country’s sovereignty, I personally find this difficult to accept.
On the other hand, there is a large number of young people who are intrigued by maps and who love to work with them. That’s who we are trying to reach out to. At the same time, although cartography is disappearing a bit, at least from Dutch academia, we are seeing an ever-increasing interest in mapping in other sciences. In the humanities there is the ‘spatial turn’, there is the ‘new cartography’ in social sciences, and in the ‘new geography’ people are trying to produce maps themselves for empowerment – although unfortunately without the training that would allow them to be aware of all the distortions that are inherent in maps.
While cartography is not doing so well in Western Europe, we are seeing a boost of interest in cartography in Eastern Europe, China, India and Indonesia. When I consider the large number of PhD students in cartography in Central and Eastern Europe, things there are looking a lot different from our situation.
Talking of education, what developmental role do maps play for schoolchildren?
They give them a geographical frame of reference. I’m not advocating that children should learn the train stops from A to B by heart. President Sukarno of Indonesia loved to tell journalists that when he was a schoolboy he had to learn all the towns in The Netherlands along the various canals by heart. Of course he thought this was totally irrelevant for someone living in Indonesia, but what he didn’t mention was that at the same time schoolchildren in The Netherlands were learning by heart all the names of the Sunda islands: Bali, Lombok, Sumbawa, Flores, Timor. Maps gave a relevant frame of reference for all inhabitants of the Dutch Empire at that time. So it is not enough to provide the tools with which children can orientate themselves geographically, but it is also important to implement a certain frame of reference. Just like in history where you need a temporal framework, you need some kind of spatial framework, and that can be provided by atlases.
Would the world be a better place if people had a greater knowledge of topography and geography?
Yes, definitely – if only to understand spatial phenomena, and of course also the fact that everything is interrelated. For example, if you dump something toxic in a river in Switzerland it will end up in The Netherlands, where it might cause the death of numerous fish. I believe that it is very important to be aware of such spatial relationships and the fact that they have an influence on the environment.
There are plans to celebrate the International Map Year in 2015. And related to this you’re working on a book together with Bengt Rystedt. Can you tell me a bit more about the book?
First of all, I should say that the initiative to have an international map year is due to be proposed by Brazil at the United Nations this summer. The idea is that, in 2015, every country pays special attention to maps, by organising map days – at schools, at libraries – and having programmes and exhibitions on mapping. To support this, this year we’re producing an appealing manual showing what cartography is all about. The first draft will be ready in time for the ICC in Dresden, Germany. Apart from the book, there will also be guides on the types of activities that can be organised in 2015.
In 2015, the International Cartographic Conference will be held in Rio de Janeiro. The International Map Year will be the main thrust of theconference. It will entail a multitude of activities that are targeted at raising interest in maps and convincing the general public of their important role. And, as a side effect, we want to increase the number of students on geography programmes.
I’m an educator, and when I see that the UNGGIM report that is to be discussed in Cambridge, UK, this summer contains a special paragraph on the importance of visualisation skills, I totally agree that there will be a need for data interpreters from a more design-oriented background. There is a need for those involved in visualising geospatial information which will be displayed on multiple devices to harness skills from other related disciplines, and this really is the part of cartography which is lagging behind. It is not only map production, but also the use of other, different ways in which we present geospatial information that should be better taught. Those in charge, the decision-makers, should be targeted specifically since they are not skilled in understanding cartographic imagery. Because images are so powerful, this could very much improve the way we understand what is spatially relevant and what is not. We seem unable to reach those decision-makers and to set up proper programmes for them: map-use programmes, spatial data-use programmes for decision-makers. I think this should be one of the spearheads of the ICA commission on education and training.
For UNGEGN, you’re working on an advanced manual. Can you tell me a bit more about this and explain its importance?
Before I became vice chair of UNGEGN, I was the convener of the UNGEGN working group on toponymy training courses. I’ve given training courses all around the world. But we realised that we were only reaching a limited group of people every time. Moreover, especially in Africa, there is much professional mobility, so that the people you’ve trained aren’t around anymore the next time you go there. This means that contact training has only a limited effect. That’s why we developed a web-based course. The training course I developed is available from the UNGEGN website, on the working group’s page about training courses. That’s a good start, but it is only at a basic level. We intend to have an advanced manual ready in time for the next UNGEGN conference, which will be in 2017. Hence, I’ve asked a number of colleagues within UNGEGN to provide various chapters which together will form an advanced manual. It will be accessible online to help those who have already completed the basic online course to develop themselves further.
Back to your specialist field that became part of your life during your childhood: is there any future for printed atlases – will they still play an important role in the future?
Yes! My reason for thinking that they will continue to have a role is the fact that you need an overview. You don’t want to look at merely a certain part of a map but rather at the whole map, and you want something tangible, at least when you’re just starting to learn about the subject. Schoolchildren need a paper document which they can hold in their hands, and realise that this is their world. There’s a big difference between how it feels when you see the world on a screen and when you have it in your hands.
There is definitely a future for paper atlases, but at the same time it’s wonderful that we have these additional digital aids which enable us to manipulate and design our maps. It’s especially the ability to play around with colours and class boundaries in digital atlases that makes us aware of how information can be manipulated. For me, this should be one of the targets of geography education, so that people know how maps are produced and can spot when the data has been visualised incorrectly.
This interview by Wim van Wegen, editorial manager at GIM International, was published in the August 2013 issue of GIM International.

Value staying current with geomatics?
Stay on the map with our expertly curated newsletters.
We provide educational insights, industry updates, and inspiring stories to help you learn, grow, and reach your full potential in your field. Don't miss out - subscribe today and ensure you're always informed, educated, and inspired.
Choose your newsletter(s)


