Creating Digital Surface Models
Non-professionals at Work
Presented here is a novel photogrammetric suite, based on computer vision algorithms, that enables non-professionals working in engineering, agriculture, forestry, the military and government to produce detailed and accurate digital surface models (DSM). The software developer illustrates its use by highlighting the generation of DSMs for soil erosion control in Canada, using archive aerial photographs.
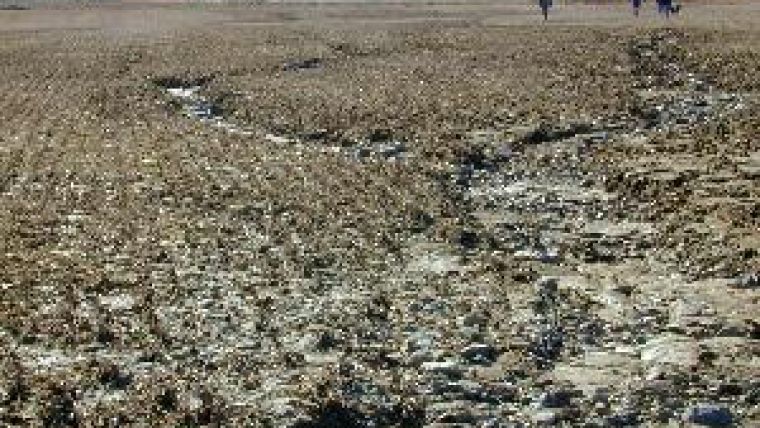
The Quebec Ministry of Agriculture (MAPAQ) in Canada developed its ‘Prime-Vert' programme to help farmers reduce the impact of pollution caused during food production. For example, pesticides and fertilizers may leach into surface water due to rainfall and surface runoff. The programme aims to improve water quality by controlling soil erosion (Figure 1), which together with inadequate surface drainage may cause water quality problems downstream, as well as reduce food productivity. The programme assists farmers in assessing potential erosion issues and supports them in establishing measures to limit environmental damage. Such measures include construction of grassed waterways or intersecting drains for the safe disposal of runoff water, or modification of terrain slope to redirect surface water.
Assessing Erosion
The assessment of erosion in farming areas requires indicators based on terrain elevation. MAPAQ personnel collect such information on site. Lack of resources limits inspection to visual assessment of terrain shape, occasionally combined with measurements taken using total-stations; costs, however, prevent their regular use. Readily available digital elevation models (DEM), such as SRTM data, are also sometimes used, but accuracy is generally insufficient. Lidar too is excluded as an option, since acquisition of airborne Lidar data is five times more expensive than recording aerial imagery.
Imagery to DSM
Aerial images, to which MAPAQ had access, were identified as a good alternative to land surveying and Lidar for providing high-quality elevation data. The 1:15,000 colour films, stored in archive, were acquired in spring 2007 (Figure 2). Government agencies typically have access to imagery as national mapping and other agencies acquire aerial photos on a regular basis, for example every three years. Even without access to these images, it would still be cheaper to acquire aerial imagery and use them to generate DSMs rather than gather Lidar data. The films were scanned with a Ground Sample Distance (GSD) of 20cm. Table 1 lists further project details.
For the automatic generation of DSMs and orthomosaics MAPAQ selected Correlator3D, as described in detail in the next section. This package was commercialised in 2009 after more than five years research and development.
Today more than a hundred licences have been sold already all over the world. Having invested less than 10% of their initial data acquisition costs, MAPAQ personnel were able to use this new photogrammetric software suite to generate high-quality DSMs with 2m GSD and 20cm vertical accuracy on each grid post (Figure 3). The accuracy, expressed as two sigma, is automatically determined and further validated using ground control points. Although monoscopic editing is supported, this was considered unnecessary for the application at hand. DSM production was carried out by personnel with some background in GIS but no previous experience in photogrammetry . The simple user interface allowed MAPAQ personnel to operate the software with minimal training.
| Image type | Scanned colour film |
| Number of images | 2,000 |
| Image resolution | 13 micrometre |
| Scale | 1:15,000 |
| GSD | 20cm |
| Area covered | 5,000sq km |
| DSM horizontal resolution | 2m |
| DSM vertical accuracy | 20m |
Table 1: Project specifications
Correlator3D
The classic matching approach is bottom-up; a point in one image is matched to its conjugate in the overlapping image. The elevation value is then computed by triangulation. Correlator3D builds on patented computer vision algorithms different from photogrammetric techniques. It uses a top-down approach wherein a seed DEM, such as SRTM, is iteratively refined. At a given iteration the elevation values in the seed DEM are slightly modified. Each point is next re-projected into both images and a correlation score calculated based on image content. If the score improves, the modification is kept. Iteration is repeated until the scores no longer improve. In traditional techniques the matching method, such as area-based or feature-based, may have a great effect on quality. Our iterative process leads to a robust approach, relieving the choice of matching method.
An important feature during development was automation to minimise time spent training users. Artificial intelligence was brought in to automatically specify parameters during processing and thus free users of manually setting them; only inputs and outputs need to be specified. The suite uses both the CPU and GPU together, resulting in rapid processing. GPUs offer high processing power, as the parallel processors support autocorrelation. Images are thus loaded into the GPU memory pair by pair, reducing memory constraints. DSM patches are then created and stored on disk. Overlapping DSM patches are finally optimised and merged.
Combining overlapping elevation values in such a way improves overall accuracy, at least for regions that overlap, depending on how the data was acquired, without the need to process blocks of images as in traditional multi-ray techniques.
Derived Products
Once DSMs were created, contours were generated using Global Mapper. The 2-m interval is a significant improvement on previous 10-m contour lines. Terrain slopes were computed with ET Surface from ET SpatialTechniques and flow paths determined using TauDEM from the Utah State University. To help MAPAQ personnel, maps were created for individual projects (Figure 4). Paper maps, consisting of information derived from the DSM superimposed on orthophotos, were prepared and used during on-site visits. Contours are shown as white lines, giving the user a general impression of terrain topography. Slope is indicated by colour according to magnitude, and flow paths are displayed as grey lines and show potential surface run-off.
Concluding Remarks
The above information has improved both the efficiency and accuracy of work done by MAPAQ personnel. The detailed maps support field inspection. Visual observations combined with DSMs facilitate better recommendations to farmers and save time. Even when highly accurate slope data has to be measured using total-stations, DSMs remain useful for planning the survey and lead to cost savings.
Acknowledgements
Thanks are due to agricultural technician Luc Lemieux of MAPAQ.

Value staying current with geomatics?
Stay on the map with our expertly curated newsletters.
We provide educational insights, industry updates, and inspiring stories to help you learn, grow, and reach your full potential in your field. Don't miss out - subscribe today and ensure you're always informed, educated, and inspired.
Choose your newsletter(s)


