Deformation Analysis of a Test Dike
A Two-year Measurement Project Using a UAS
Dikes play a vital role in preventing floods around the world. Typically, dikes are made of clay or marl, but these soil materials are becoming scarce in some regions. In Germany, an experimental test dike was constructed to evaluate the suitability of three other materials. Terrestrial laser scanning (TLS) and photogrammetry from an unmanned aerial system (UAS) were used to monitor the deformations of the dike. This provided valuable insights, not only into the dike deformations but also into the suitability of UAS photogrammetry for deformation monitoring.
(By Matthias Naumann and Ralf Bill, University of Rostock, Germany)
The accuracy of deformation monitoring is determined by both the spatial and the temporal resolution of the observations. Laser scanning is a suitable method to achieve a high spatial resolution, but also comes at a high cost. Hence, it is uneconomical to apply laser scanning with a high repeat frequency. Now that UAS-based photogrammetry is becoming a mature technology, a new and affordable tool for deformation analysis is available. To test the accuracy and hence suitability of UAS photogrammetry for dike deformation monitoring, five surveys were performed over a test dike and the results were compared against a terrestrial laser scan survey conducted for reference purposes.
Test Dike
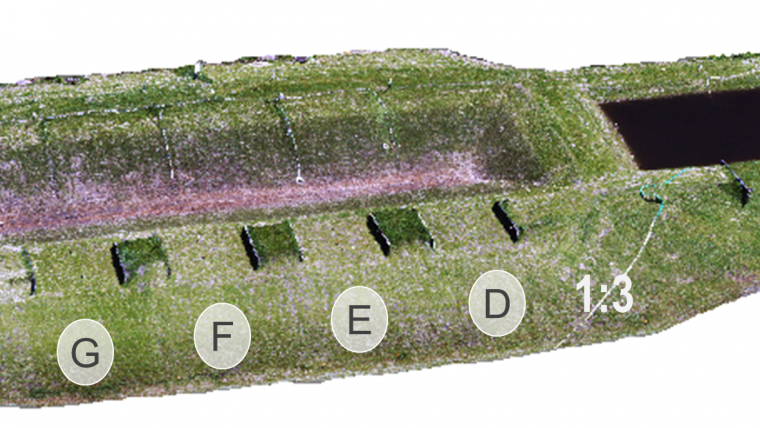
Dredging is necessary in many harbours and waterways around the world to maintain sufficient depth for shipping, and the dredged material is pumped onshore into basins where it is prepared for re-use. Until now, it has been difficult to re-use the fine-grain fractions in that material. To evaluate whether those fractions could be suitable for building dikes, a number of test dikes have been constructed within the international DredgDike project. One such large-scale experimental test dike is located in Rostock-Markgrafenheide, Germany (Figure 1). The dike has been made entirely from materials dredged from the nearby harbour and waterways.
There are two parallel dikes approximately 130m long and 3.3m high. The dikes are used to form a number of polders that can be filled with water for testing purposes. Along the dike, eight different regions are defined. These regions vary in the type of dredged material, slope and the applied geosynthetics. One side of the dike is used to test seepage and moisture, while the other side is used for overflow experiments.
Two Multirotor Platforms
There are many micro UASs available on the market nowadays, and they often excel in either payload capacity or flight duration. The decision was taken to fly two different systems for the deformation tests in order to compare and evaluate the systems. The first three surveys were flown with the MD4-1000, a quadrocopter from Microdrones with the Olympus PEN e-P2 camera using a fixed focal length of 17mm. The final two flights were conducted using the AscTec Falcon 8, an octocopter from Ascending Technologies GmbH with the Sony NEX-5 camera and a focal length of 16mm. Both UASs are standard models without further additions and integrate a GNSS, an inertial measurement unit and an active stabilising camera mount. For oblique-looking photos the Falcon 8 is predestined, which is suitable for steep areas or retaining walls. Due to its much longer flight time capability, the MD4-1000 is suitable for larger or longer dike sections.
More than 11 well-distributed ground control points were determined with accuracy of a few centimetres using GNSS-RTK. In addition, six checkpoints were surveyed with RTK and about 30 checkpoints were surveyed with a tacheometer. These checkpoints were used to cross-validate the digital surface models (DSMs) computed from the images.
Five Survey Flights
The five survey flights were conducted between June 2012 and June 2014 to measure the deformations after completion of the dike (Figure 2). The aim of the flights was to compute an accurate DSM of the dike from the images. To do this, the software needs to find corresponding points in multiple images. These points can only be found if they can be clearly identified in each image, and the extremely homogeneous texture of the dike makes that particularly challenging. Therefore a very high image overlap was used, namely 80% along the flight line and 60% across the flight line, so that each point on the ground was potentially covered in at least five pictures. Doing so increased the number of observations and produced more accurate automatic aerial triangulation results. In addition, this ensured high-contrast photographs and well-distributed control points.
The first flight was flown at a height of approximately 75 metres. However, in the subsequent flight the ground surface become increasingly harder to recognise due to vegetation cover. Since a higher image resolution would increase the probability of finding ground surface points, the flying height was reduced to 53m for the third flight and 38m for the final two flights to improve the resolution.
Creating the DSM
All data was processed using the UAV processing software from the company Pix4D. The ground control points were measured manually in the images and the software then automatically generated the DSM (Figure 3). The spatial resolution of the DSMs was 2.5cm for the flights at 75m altitude, 1.5cm for the flight at 53m and 1.3cm for the flights at 38m.
During the first flight, the dike was simultaneously surveyed with TLS. This process took about twice as long as the UAS survey but provided very good reference data for a quality comparison against the computed DSMs. The UAS and the TLS data correlated very well with a standard deviation of 2cm after filtering the outliers. Using the tacheometric check points to reassess the quality in each subsequent flight consistently revealed a standard deviation of about 3cm.
The data from the UAS was especially good on continuous surfaces with little vegetation. However, the DSM contained large errors of up to 20cm in certain areas, such as sandy terrain with a homogeneous texture or locations with abrupt jumps in height. Poles and edges of walls were also not represented correctly in the DSM. This error behaviour did not pose a problem for the analysis since the focus was only on large-scale terrain gradients.
Deformation Analysis
Using the DSM from the first flight as reference data reference data, it was compared with the DSMs from all subsequent flights by computing the differences in height for each cell using a cell size of 2.5cm. In addition to containing some large errors as mentioned above, the DSM also visibly showed people and technical equipment. Such areas were masked manually so that they would not influence the deformation analysis. During flights 3, 4 and 5 the surface was so densely covered with grass that it was no longer possible to see the ground surface in the images. Therefore the DSM computed from that data represents the height of the grass rather than the height of the terrain. However, based on the assumption that the vegetation height was constant over the entire area, it could easily be corrected by subtracting the assumed vegetation height.
As expected, UAS measurements confirmed the settlements of the dike to be several tens of centimetres: after one year, the settlements were between 17.5cm and 22.5cm (Figure 4), with the rate of settlement slowing in the second year. Settlement does not occur evenly along the entire dike. There are larger differences at the eastern dike, probably because of the greater volume of that dike, while small areas with positive difference are mainly due to vegetation growth. Other small changes were also detected, such as when manmade objects were removed from the scene for instance.
Concluding Remarks
UAS photogrammetry is a very fast and cost-effective method for producing DSMs, especially when accessibility is an issue. The study found that an accuracy of approximately 4cm can be achieved on continuous terrains with sufficient texture and little vegetation. The accuracy will be lower on other terrain types.
Further Reading
- Naumann M., Bill R., Niemeyer F. (2014): Deformation Analysis of Dikes using Unmanned Aerial Systems (UAS). In: Proceedings of the South Baltic Conference on Dredged Materials in Dike Construction, Rostock, Hohe Düne 10/11 April 2014, Edited by Fokke Saathoff & Stefan Cantré, chair of geotechnics and coastal engineering, University of Rostock, ISBN:978-3-86009-409-9.
- Naumann M., Geist M., Bill R., Niemeyer F., Grenzdörffer G. (2013): Accuracy Comparison of Digital Surface Models Created by Unmanned Aerial Systems Imagery and Terrestrial Laser Scanner. The International Archives of the Photogrammetry, Remote Sensing and Spatial Information Sciences (ISPRS Archives), Commission IVWG I/5, Volume XL-1/W2.
The Authors
Dipl-Ing (FH) MSc (GIS) Matthias Naumann studied surveying at the University of Applied Sciences in Berlin (Germany) and geoinformation systems and science at the University of Salzburg (Austria). Since 2001 he has been working at the Department of Geodesy and Geoinformatics at the University of Rostock (Germany).
E-mail: matthias.naumann@uni-rostock.de
Prof Dr-Ing Ralf Bill studied surveying at the University of Applied Sciences in Mainz and the universities of Karlsruhe and Berlin (Germany). Since April 1994 he has held the position of chair of geodesy and geoinformatics at the University of Rostock.
E-mail: ralf.bill@uni-rostock.de

Value staying current with geomatics?
Stay on the map with our expertly curated newsletters.
We provide educational insights, industry updates, and inspiring stories to help you learn, grow, and reach your full potential in your field. Don't miss out - subscribe today and ensure you're always informed, educated, and inspired.
Choose your newsletter(s)


