Digital models for planning and disaster management
Lidar-derived shack footprint for the city of Cape Town
Due to the local region’s proneness to occasional wildfires, the Geomatics Division at the University of Cape Town, South Africa, has conducted research and project work around the theme of 3D reconstruction plus contemporary urban mapping for planning and disaster management. This article shares some highlights.
High-resolution images derived from multiple platforms with on-board sensors provide substantial cues in urban planning and are strategic in disaster management. Where risks are prevalent, the gathered datasets present geospatial engineers with opportunities to process and document both pre- and post-disaster scenes at multiple temporal and spatial scales for delivery in 2D, 3D+ and related digital models. The image scenes themselves are also very fascinating, as they present complexities of mixed land covers, multipart roof facades, multiple spectra and at times multiple data types. For example, the availability of airborne laser scanning (ALS) and radar data presents options for fused solutions. 2D and 3D+ reconstructed models have become an eminent fundamental in planning, emergency rescue and post-disaster logistics.
Contemporary urban scene reconstruction in a changing modern world
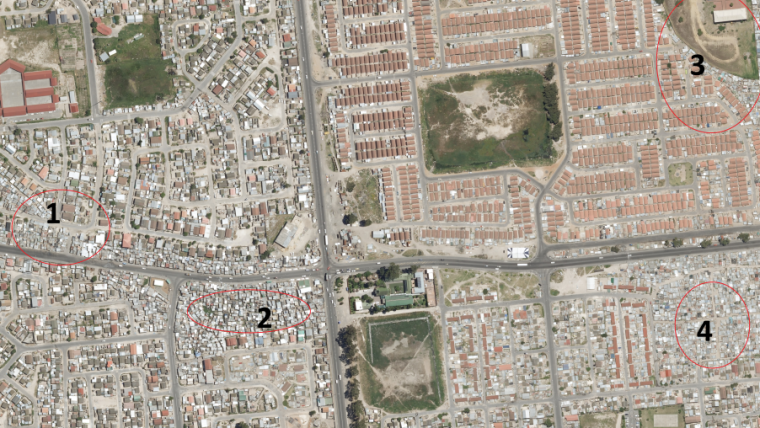
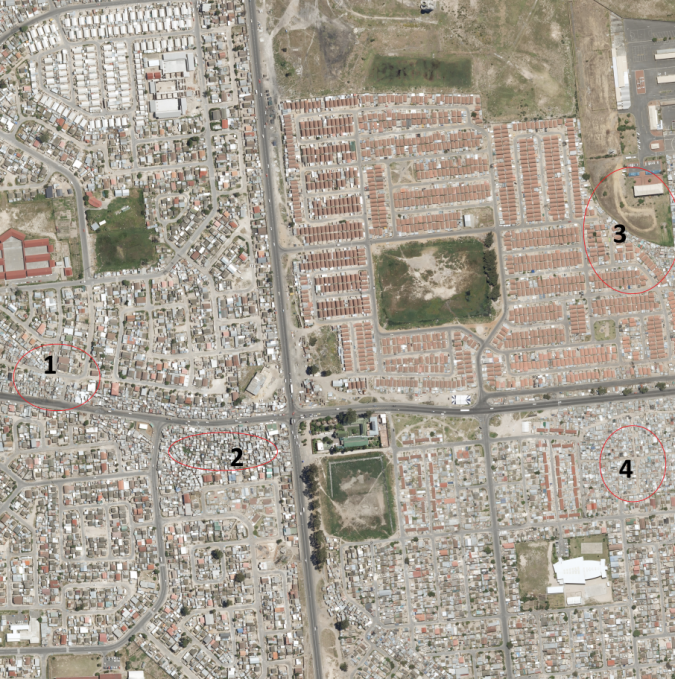
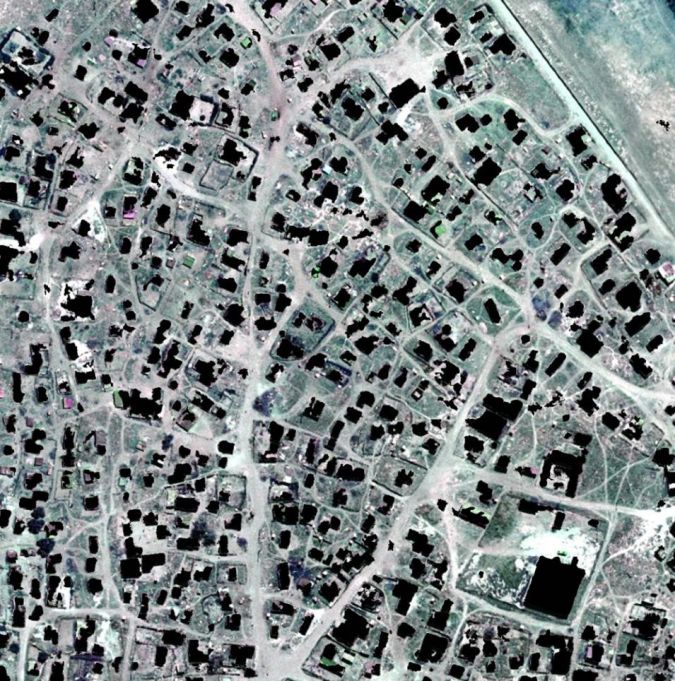
In today’s world, disruption is constant and logical planning is under threat with most aspects of human life deferring to more organic and novel patterns of progression. Over the years, modern urbanism has not been spared and is often characterized by a spontaneous nature with diverse social impacts. The emerging patterns of habitats channel a need for cartographic sensitivity to represent the interests of multiple groups without exclusion in comprehensive mapping solutions. Literature posits that cases such as the City of Cape Town in Western Cape Province, South Africa, resonate a need for broad mapping as the city has been categorized as one of those exhibiting inequalities. The social dimensions captured in related studies also translate to image-based difficulties for geospatial mappers. High-resolution aerial footage of parts of Cape Town (see Figure 1) shows mixed land covers with informal cover nucleated on the backdrop of formal residential spaces apart from a mixture of vegetation, tar, soil and concrete that are adding more seasoning to the ‘salad’. This mixed context detail is key to the discussion in this article, which highlights ongoing project work relevant to mutual mapping initiatives in contemporary urban spaces.
Besides capturing the geomatics-relevant context of previous project work, the authors focus mainly on more recent work that is based on three-dimensional mapping of spaces within a post-fire Southern Cape Town. They also summarize the general application of ALS and high-resolution aerial imagery in extracting built structure footprints for reconstruction. More recent work is rooted in UAV-based data capture of post-fire scenes for deep learning and mapping. Wildfires are selected as a risk theme in order to link with the context of disaster management application in projects.
Table Mountain fire in 2021
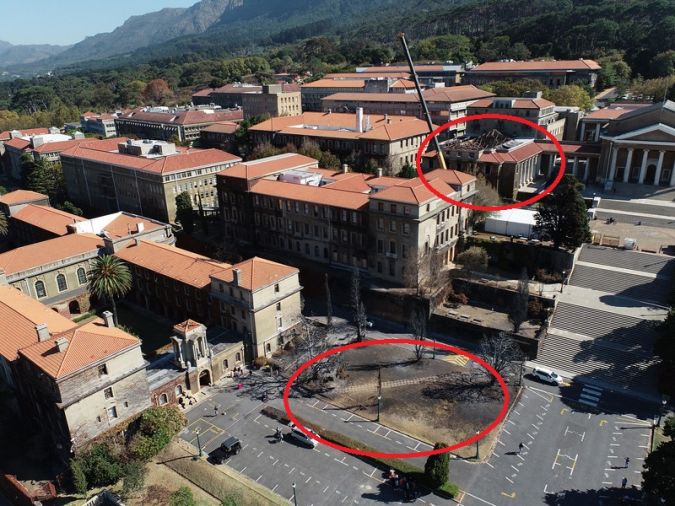
Located on the south-western coast of South Africa, Cape Town has been prone to occasional fires in multiple areas over the years. The fires are often attributed to katabatic wind regimes, fynbos biomes and diverse factors. In April 2021, an erratic runaway fire engulfed the surrounds of the Table Mountain forests. Post-fire inventory revealed severe damage to several commercial properties including the famous historical Mostert’s Mill (built in 1796), the Rhodes Memorial restaurant and Jagger Special Collections Library (Figure 2) which holds rare and irreplaceable collections, antiques and significant documentation of the San and Khoi people who lived in the area in the 1870s. In addition, one should not underestimate the resulting displacement of residential, natural, human and animal life. Although not the first fire to cause significant losses in Cape Town, the Table Mountain case emphasizes the importance of mapping as an investment in disaster risk reduction and its impact mitigation.
Collecting and documenting the Cape Footprint
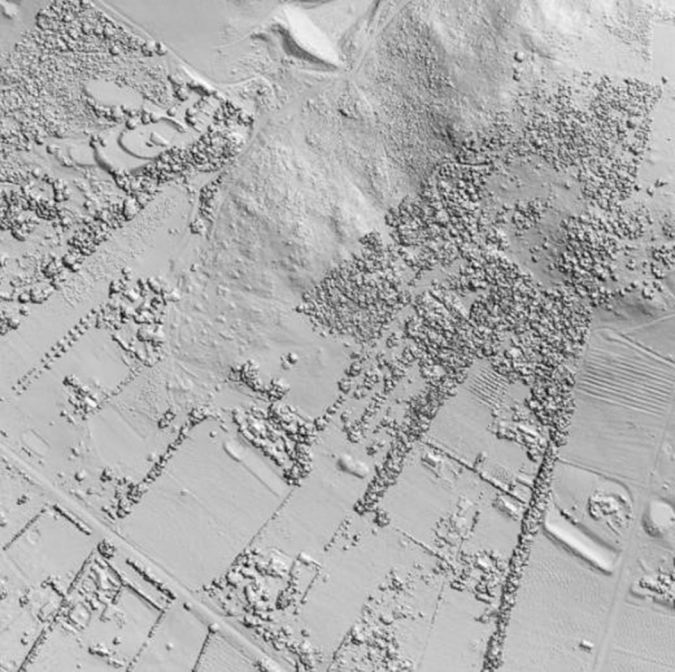
Since both formal and informal spaces are risk-prone to wildfire hazards in Cape Town, mapping all areas before and after damage aids day-to-day city administration plus cases of crisis search, rescue and restoration. Buildings and related man-made structures (including shacks where these exist) become of fundamental interest to the administration matrix as they house human life which may require rescue or may have been displaced and require mitigation efforts. When one inspects nadir optical images, the predominance of diverse roof detail is imminent and it causes low-level algorithms to fail in facade identification, prompting a need for more robust processing techniques for model creation. Both ALS, satellite and aerial footage of Cape Town is available to collaborating institutions for research purposes. Some earlier postgraduate research work engaged on an approach for mapping the informal structures within Cape Town utilizing a combination of very high-resolution (VHR) imagery (5cm resolution) obtained from an aerial survey in combination with 2-3 points per square metre airborne laser scanning (ALS) data. A random extract of an ALS image from the dataset collected over Cape Town is presented in Figure 3 as a tinted hill shade model.
In the latest research, the task was to develop a novel framework for shack unit extraction founded on two views, namely that spatial data fusion can improve accuracy and that reliable spatial information on informal settlements can be extracted based on an organicism-informed approach. The organicism perspective was motivated by an analogy arguing that informal settlements are similar to the layouts of living tissue and that, as seen in cell and organ imagery, learning points from how bioinformaticians choose to isolate individual cells can inform cues for an effective shack extraction strategy. Figure 4 shows some of the primary products of an organically inspired extraction from the study, where the man-made shack candidates were separated from the background.
With a broad-ranging approach in mind, a recent project has also focused on formal documentation of southern suburbs of Cape Town where the 2021 Table Mountain fire occurred. There was an unmanned aerial vehicle (UAV or ‘drone’) flight collecting footage of post-fire scenes immediately after the fire with a multispectral and Lidar scanner in a separate project. Currently, a thermal scanner with RGB sensor on board is scheduled to collect footage of the spaces closer to the foot of Table Mountain National Park. Existing survey control marks which were placed by static GNSS surveys in the extents of the University of Cape Town (UCT) campus will be highlighted and used as ground control points for checks and consistency. The main points of interest from the RGB imagery are the building facades, highlighting damage and progress on restoration, as well as some natural features affected. The thermal imagery can also inform on damage to piping and related property maintenance aspects in greater detail. Artificial intelligence, and particularly deep-learning convolutional neural networks, will be key to the identification and extraction of building facades with damage.
Future plans
At the moment, the bulk of the work is scheduled around field reconnaissance and scheduled data collection using UAVs. Flight permissions continue to be a challenge for drone-related work, with tight regulations in place and various licensing constraints. However, industry partners can make this easier as they are more invested to fly more regularly than research units. Future work will include completing the data processing using deep learning and complementing some of the building datasets with ground-based laser scanning data. The authors are also eager to test the iPhone 12 Pro Lidar camera, mainly out of curiosity.
Acknowledgements
The authors acknowledge the City of Cape Town as a provider of aerial and ALS data from its annual surveys, Associate Professor Julian Smit for his role as advisor to the postgraduate work cited in the article, and Daniel O’Sullivan Hewlette and Walter Uys with UAV Industries for their collaboration on UAV mapping.
More information
Introduction to the Geomatics Department at UCT: https://youtu.be/nZe3uH3pCg4
Lidar-derived shack footprint for the city of Cape Town, South Africa: https://doi.org/10.1080/03736245.2020.1863253

Value staying current with geomatics?
Stay on the map with our expertly curated newsletters.
We provide educational insights, industry updates, and inspiring stories to help you learn, grow, and reach your full potential in your field. Don't miss out - subscribe today and ensure you're always informed, educated, and inspired.
Choose your newsletter(s)


