Climate Change and Geomatics
There is a strong consensus among scientists that accelerated sea-level rise induced by greenhouse warming is likely to become a major environmental problem over coming decades. The rise in global sea level is attributed to thermal expansion of the ocean, the melting of temporate-latitude glaciers, and net loss in mass from ice-sheets in Greenland and the Antarctic. During the coming century sea-level rise is expected to continue at an increasing rate. In addition to the obvious consequences for coastal regions, an influx of ice-sheet melt water may cause significant change in the circulation of world oceans, thus triggering large-scale climatic perturbation. What does all this have to do with geomatics or, if you prefer, geospatial information technology?
Mapping and monitoring of the Polar Regions is essential for understanding the current balance in mass of the Greenland and Antarctic ice-sheets and their contribution to global sea-level change. The advent of civilian satellites has greatly improved our ability to monitor the polar ice-sheets and dramatic changes in both ice-sheets have been documented. However, these changes refer to the last ten to fifteen years. To assess their significance and evaluate the longer-term behaviour of Greenland and Antarctica, ongoing observed changes should be placed within a broader, temporal context. Since the late 1930s hundreds of thousands of aerial photographs have been collected in parts of Greenland and Antarctica, allowing the change detection timeline to be extended back fifty years. These historical photographs are archived by various institutions and it is becoming increasingly difficult to locate this material and obtain relevant metadata. Moreover, old photographic film deteriorates, limiting its usefulness for precise measurements. Permit me the analogy: historical photographs of the Polar Regions and temperate-latitude mountain glaciers are an endangered species, verging on extinction. The geomatics community can (and should!) come to the rescue. We have an obligation to save this invaluable source of information.
The role of geomatics in climate-change discussions is, however, not limited to the preservation of historical photographs. To better understand the effect of changes in Polar ice-sheets and mountain glaciers it is imperative that the input parameters for ice-sheet and glacial-flow models be determined in as a quantitative a form as possible. This requires close collaboration with glaciologists and climatologists so that they may be provided with relevant information. Relevant information must be extracted from multiple sources: historical photography, satellite imagery, laser point-clouds, and radar data. We are confronted with the formidable problem of converting data from multiple sources into useful, quantitative information. By `useful’ I mean surface-elevation change, velocity, strain rates and all their associated uncertainties. To increase the richness and robustness of information it must be obtained through true fusion: simultaneous extraction of information from different data sources to exploit mutual synergism.
Geomatics can make a substantial, quantitative contribution to one of today’s most hotly debated topics, climate change.
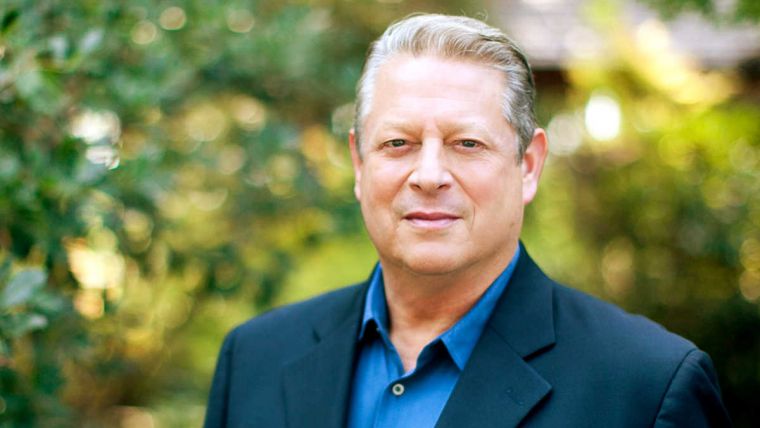
The photo shows the Al Gore, former US Vice President and recent Nobel prize-winner, photographed discussing the way in which declassified satellite images (DISP) are used for detecting change in Greenland’s ice sheets and outlet glaciers. It was Al Gore who officially announced the US government decision to declassify these images.

Value staying current with geomatics?
Stay on the map with our expertly curated newsletters.
We provide educational insights, industry updates, and inspiring stories to help you learn, grow, and reach your full potential in your field. Don't miss out - subscribe today and ensure you're always informed, educated, and inspired.
Choose your newsletter(s)


