Geomatics Makes Smart Cities a Reality
Enriching 3D Building Models with Non-spatial Data
Today, the main use of 3D building models is for visualization purposes. However, such models also have huge potential for supporting the ‘smart city’ concept. Disaster management, 3D cadastres, energy assessment, noise & pollution monitoring and visibility analysis could all benefit from enriched 3D building models. To demonstrate this potential, this article presents three case studies in which 3D building models have been enriched with non-spatial data. The datasets can be visualized and managed online within a web-GIS platform.
The technologies for capturing and processing 3D geodata are rapidly advancing. Aerial images processed with dense image matching algorithms result in automatically generated dense point clouds. Likewise, the data capture rate of Lidar sensors is still rising. As a result of these developments in geodata acquisition technology, the availability of 3D geodata is steadily increasing. Indeed, photogrammetry and Lidar together with 3D city modelling tools form the essential foundation for creating 3D textured building models.
Smart Cities
The current use of 3D building models is mainly confined to visualization, which leaves many other potential applications underexploited. This is a pity, since urban managers and planners could benefit tremendously from 3D city models. This is especially true in light of the rapid urbanization worldwide, which requires continuous monitoring of energy consumption, noise pollution and many other ‘smart city’ applications. Therefore, the major challenge for today’s geomatics professionals is to create affordable technologies that make optimal use of geodata and automated 3D city modelling tools. This includes the combination of these geomatics products – consisting of reconstructed 3D geometries – with non-spatial data such as building materials, number of floors and data captured by smart meters and noise sensors. Such efforts will result in a richer understanding of urban ecosystems and thus increase the liveability and safety in ever-expanding cities. More than half of the world population is already living in cities (an urbanization milestone that was reached back in 2008) and it is envisaged that this share will be two-thirds by 2050, so there is a clear need for more efficient mapping, understanding and management of urban areas.
Bottlenecks
Airborne imagery has been and continues to be the main source for detailed 3D modelling of urban scenes. Nadir and oblique aerial images can be captured with high ground sampling distances (GSDs) providing highly detailed RGB and point cloud data. The main bottleneck in exploiting the full potential of 3D city models lies not in the availability of geodata, but rather in the lack of fully automatic and broadly applicable software tools. For example, commercial tools for processing aerial images do not enable the integration of the relative orientation parameters of multi-camera systems, which capture both nadir and oblique images, as constraints in the bundle adjustment. Furthermore, the matching of oblique and nadir images does not run smoothly. Added to this, during mapping, the available building primitives do not represent all possible architectural shapes, particularly in historical city centres, and façade point clouds are generally not considered during the fitting of primitives.
Non-spatial data
Enriching 3D city models with non-spatial information supports visibility analysis, urban planning, establishment and maintenance of 3D property cadastres, emergency response, estimation of the photovoltaic potential of roofs and energy demands, and other needs. These types of information are essential for city planners, policymakers, public administrations and many other users. The enrichment of 3D building models with additional information requires the realization of a scalable system able to store, manipulate, analyse, manage and visualize different types of spatial and non-spatial data and their interrelationships.
Bergamo, Trento and Graz
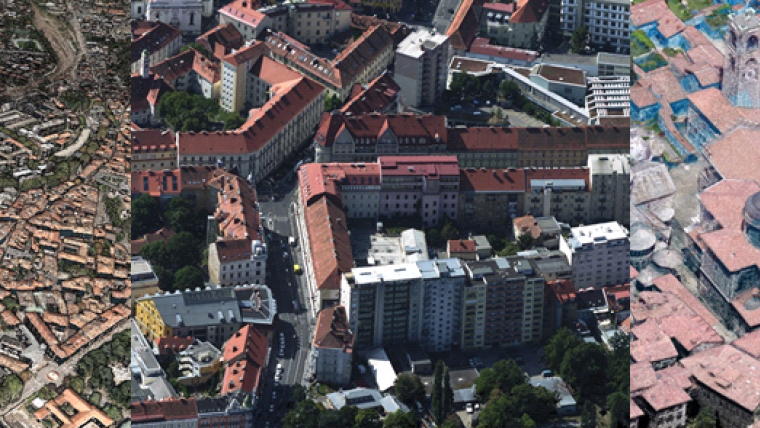
From an algorithmic point of view, the production of 3D city models from dense point clouds can be classified into two main groups. The first group fits templates of specified roof shapes or building shapes to a point cloud. The second group simplifies 2.5D or 3D meshes derived from the point cloud until they meet ad-hoc geometric and semantic criteria. These two main groups have both been applied to aerial images of Bergamo (Italy), Trento (Italy) and Graz (Austria). Images of Bergamo and Trento were acquired by AVT/Terra Messflug GmbH Austria and of Graz by Vexcel. The size of the captured area is 5.3km by 5.6km for Bergamo, 3.5km by 1.5km for Trento and 3.0km by 1.5km for Graz. Table 1 provides further details about the three aerial surveys.
|
|
Bergamo |
Trento |
Graz |
|
Area |
5.3km x 5.6km |
3.5km x 1.5km |
3.0km x 1.5km |
|
# nadir images |
100 |
400 |
20 |
|
# oblique images |
4300 |
- |
160 |
|
Camera |
UltraCam Osprey Prime |
UltraCamXp |
UltraCam Osprey Prime |
|
f nadir [mm] |
82 |
100 |
51 |
|
f oblique [mm] |
123 |
- |
80 |
|
GSD [cm] |
12 |
10 |
12 |
|
along/across overlap |
80/60% |
80/60% |
75/65% |
|
|
|
|
|
Table 1, Details of the three aerial surveys; f: focal length of the camera, GSD: average nadir GSD in nadir images; all cameras are from the Vexcel stable.
The aerotriangulation (AT) was performed with ground control points (GCPs) and GNSS observations of camera centres, included in the bundle block adjustment process as observed unknowns. The AT accuracy reaches values below the mean GSD of the captured images. Dense point clouds were then produced using the nFrames SURE image matching software. After georeferencing, two distinct workflows were adopted to create the 3D building representations at the second level of detail (LOD2). Whereas LOD1 shows buildings as blocks with flat roofs, for example, LOD2 shows finer details such as roof shapes and protrusions in the façades. The Hexagon/tridicon suite of tools was applied to create the 3D building models, fitting roof primitives to the pre-segmented point cloud (hence the first group of 3D modelling approaches) for Trento and to the simplified 3D meshes for the Graz dataset. For the Bergamo dataset, both approaches were applied (Figure 2).
The reconstructed geometries of buildings have been enriched with energy-performance certificates, artificial night-time light locations and emissions, building property details and other non-spatial information. The building property details consist of, amongst other things, the owner’s name, the number of floors, the number of rooms and building surface materials.
Web-based Visualization
The 3D building models and the linked non-spatial information are stored in two different data containers. Efficient managing of both data containers may be done through a service platform accessible from a web-based client. In collaboration with Trilogis Srl, the authors developed a dedicated web-GIS platform based on the NASA Web World Wind API to store, access, analyse and update the heterogeneous information linked to the 3D building models. The main potentialities of the approach include: (1) 3D navigation, data visualization and rendering, including sources of artificial night-time light and thermal maps; and (2) data query and editing, displaying non-spatial data in pop-up windows where information can be edited, enriched and updated. An example for the city of Trento is shown in Figure 3.
Concluding remarks
3D geodata and geoinformation technologies will be key in supporting smart city concepts. 3D city modelling has attracted significant attention in recent years with numerous potential application fields, but there are many remaining challenges. One such challenge is that 3D buildings should represent more than just a realistic view of the urban environment, and an extension towards semantically enriched 3D city modelling is envisaged. Secondly, 3D modelling still lacks important automated components, and existing tools should be generalised towards the representation of different and more realistic urban scenes. Thirdly, the development of a common standardized data model is required, along with advances in hardware and software to manage massive datasets efficiently.
Acknowledgements
Thanks are due to project partners Trilogis (Italy), AVT/Terra Messflug GmbH (Austria), Municipality of Bergamo (Italy) and Municipality of Trento (Italy).
Further Reading
- Biljecki, F., Stoter, J., Ledoux, H., Zlatanova, S., Çöltekin, A. (2015) Applications of 3D city models: State of the art review. ISPRS Intern. Journal of Geo-Information, Vol. 4(4), pp. 2842-2889.
- Lafarge, F., Mallet, C. (2012) Creating large-scale city models from 3D-point clouds: a robust approach with hybrid representation. Journal of Computer Vision, Vol. 99(1), pp.69-85.
- Remondino, F., Toschi, I., Gerke, M., Nex, F., Holland, D., McGill, A., Talaya Lopez, J., Magarinos A., (2016) Oblique aerial imagery from NMA – Some best practices. Archives of Photogrammetry, Remote Sensing and Spatial Information Sciences, Volume 41(B4), pp. 639-645.
- Toschi, I., Nocerino, E., Remondino, F., Revolti, A., Soria, G., Piffer, S. (2017) Geospatial data processing for 3D city model generation, management and visualization. ISPRS Int. Arch. Photogramm. Remote Sens. Spatial Inf. Sci., Vol. XLII-1-W1, pp. 527-534.
- Toschi, I., Ramos, M.M., Nocerino, E., Menna, F., Remondino, F., Moe, K., Poli, D., Legat, K., Fassi, F. (2017) Oblique photogrammetry supporting 3D urban reconstruction of complex scenarios. ISPRS Int. Arch. Photogramm. Remote Sens. Spatial Inf. Sci., XLII-1-W1, pp. 519-526.

Value staying current with geomatics?
Stay on the map with our expertly curated newsletters.
We provide educational insights, industry updates, and inspiring stories to help you learn, grow, and reach your full potential in your field. Don't miss out - subscribe today and ensure you're always informed, educated, and inspired.
Choose your newsletter(s)


