GIS data is indispensable for UN migration agency
Better context-specific assistance and sound policymaking
The International Organization for Migration is a heavy user of GIS data. Accessible, reliable and timely geospatial data is indispensable in its work in today’s fast-changing world, in which more than a hundred million people were displaced globally in May 2022 alone. Harnessing the power of geospatial data is not only essential for migration-related policymaking, but also to support informed decision-making and effective action on the ground in a humanitarian crisis.
The International Organization for Migration (IOM), which is part of the United Nations System, provides services and advice to realize humane and orderly migration for the benefit of all governments and migrants. Geospatial information systems (GIS) and data management are extremely important for IOM’s mission. “Geospatial data is completely linked into the fields of migration and internal displacement, which are entirely location-based,” states Mohamed Bakr, geographical information systems officer at IOM’s head office in Geneva, Switzerland. GIS tools have a broad range of applications for IOM, in particular for its Displacement Tracking Matrix (DTM) covering the whole world.
Tracking displaced populations
The DTM is used to gather and analyse data to disseminate critical multi-layered information on the mobility, vulnerabilities and needs of displaced populations. The matrix provides IOM and other stakeholders with evidence-based data so that they can make informed decisions about aid and recovery planning in affected communities. “We systematically manage geospatial information on human mobility patterns across the globe. With more than 7,000 data collectors and over 600 technical experts serving in over 80 countries, the worldwide presence of the Displacement Tracking Matrix is immense. Our published output – reports, maps and datasets – has been downloaded nearly 1.5 million times. It improves operational efficiency, especially in humanitarian crises in which reliable and up-to-date data on displacement dynamics can have lifesaving consequences,” he continues. Needless to say, GIS online visualizations display key results and indicators on easy-to-read maps and statistical products for a broad audience. For example, in response to the COVID-19 pandemic, DTM’s Geospatial Analytics team supported geospatial visualization of COVID-19 impacts on human mobility at global, regional and country levels.
Besides the DTM, geodata is also collected for IOM’s Missing Migrants Project, which was implemented in 2014 to document deaths and disappearances during migratory journeys worldwide. “Each location represents an incident of a migrant death or disappearance. Each number represents a person, as well as the families and communities that they leave behind. The recorded geolocations of incidents are estimations, but they are key to mapping the risks that people who leave their homes in search of a better life face during their journeys,” states Bakr. “We recently reached the grim milestone of 50,000 recorded deaths during migration. The many data challenges of documenting deaths during irregular movements mean that many more remain undocumented.”
Challenges
He and his 25 fellow GIS experts worldwide assist IOM’s operations by ensuring the effective use of systems and data infrastructure, especially during emergencies. It is also their responsibility to coordinate the DTM Central Data Warehouse and to ensure smooth data flow from different assessments and geospatial data collections to the IOM/DTM websites, geoportals and other applications.
There are specific data-management challenges to tackle since it often concerns regions where – certainly at that moment – the only geodetic data available is unreliable. “Fast territorial changes due to natural disasters or unavailability of official administrative boundaries make it difficult to have a solid base to collect and visualize data at the lowest administrative level,” explains Bakr. “We mostly work around this by developing operational boundaries to ensure data is collected with proper quality. These operational boundaries are only for limited use for the purpose of informing the humanitarian community of the most accurate displacement and migration trends.”
Another special concern is the access to data about the actual situation. Satellite imagery and GIS maps are key to providing the disaster response teams with the necessary information for assessments and monitoring. Given the difficulty of obtaining the most recent, high-resolution imagery in a timely manner, it can be challenging for the teams on the ground to prioritize interventions and ensure effective response. “To tackle this, we request satellite imagery from different providers at the same time, in the hope of having these images available for analysis as soon as the event takes place. In many cases we can foresee that they will happen, only we don’t know exactly when.”
Remote sensing
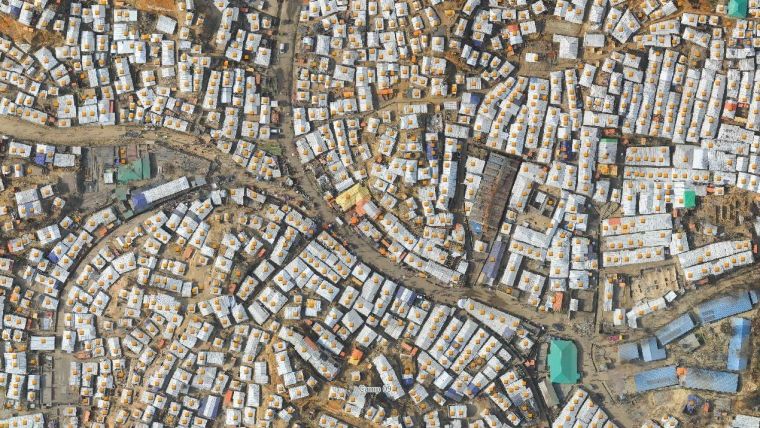
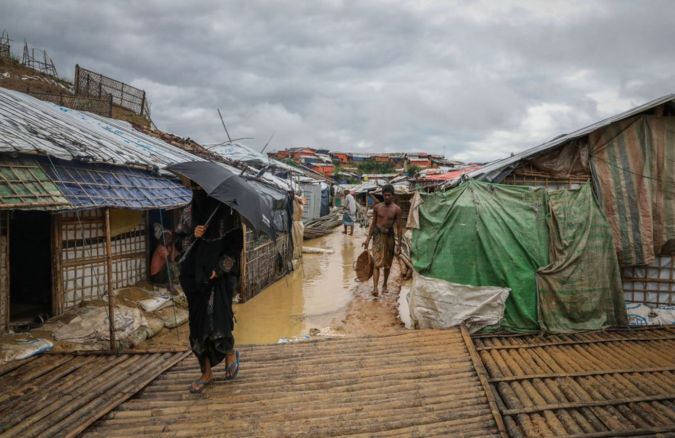
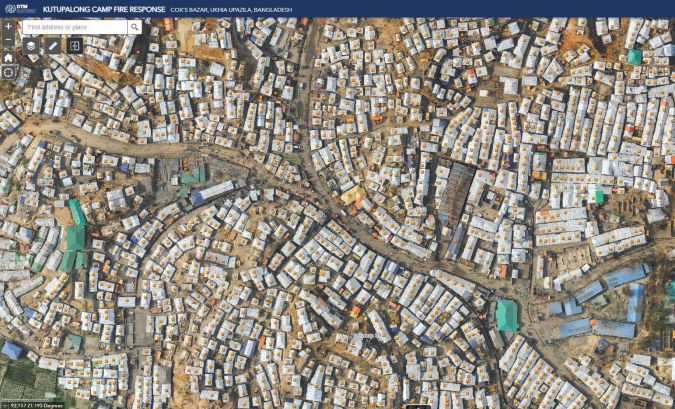
In cooperation with other humanitarian organizations, Bakr and his team would like to put in place an infrastructure for utilizing remote sensing to support rapid response, risk reduction and planning in places that are not mapped or are in inaccessible locations. “We are very interested in the responsible implementation of remote sensing using UAVs (unmanned aerial vehicles, Ed.) and satellite imagery in combination with artificial intelligence and machine learning. That makes it possible to quickly disseminate information which enables decision-makers and aid workers to provide the migrating populations with better context-specific assistance,” he says. One example is a monitoring programme set up in Bangladesh which tracks needs and vulnerabilities through a broad information management framework. The locations where people found shelter during the recent flooding are tracked and mapped using machine learning (in collaboration with the United Nations Satellite Centre). The data for the map showing the temporary whereabouts is based on UAV imagery analysis. High-resolution elevation data from the UAV imagery has allowed IOM (in cooperation with NASA) to model future floods and landslides. “This will also enable us to analyse the shelters at risks in these areas and support adequate response.”
When asked about the priorities for next year, Bakr answers: “Priorities are ruled by what we see happening. But for us as geoinformation experts, we will pay special attention to providing live feeds of migration trends and other relevant data into the UN Network Geospatial Data Hub. We will share our geospatial analytics methods with all UN agencies. This will strengthen the global availability of evidence-based geospatial data on migration and displacement. If that enhances better-informed decisions, the positive impacts for migrants and society as a whole can be huge.”
About the International Organization for Migration
Established in 1951, the International Organization for Migration (IOM) is the leading intergovernmental organization in the field of migration. The organization is part of the United Nations System and counts 174 member states, 8 states with observer status, and offices in over 100 countries. The organization is dedicated to promoting humane and orderly migration for the benefit of all. It has a budget of US$2.5 billion and 17,761 staff operating across 523 locations. IOM assists in the search for practical solutions to migration problems and provides humanitarian assistance to migrants in need, including refugees and internally displaced people. Last year, despite the impacts of the COVID-19 pandemic, IOM’s humanitarian aid reached 31.7 million people. The organization also stands for the advance of international migration law, policy debate and guidance, protection of migrants’ rights, migration health and the gender dimension of migration.
This article is focused on GIS and IOM’s displacement tracking. In 2021, data on population mobility was collected, analysed and disseminated in 78 countries. With geospatial analysis of displacement and flow data, the Displacement Tracking Matrix (DTM) has resulted in the publication of over 2,400 reports, mapping products and datasets, and its products have been downloaded 1.5 million times. In addition to being systematically deployed in humanitarian response operations, recovery and return processes, the DTM is also highly effective as a preparedness tool, e.g. for mapping potential evacuation and displacement sites.
Further reading

Value staying current with geomatics?
Stay on the map with our expertly curated newsletters.
We provide educational insights, industry updates, and inspiring stories to help you learn, grow, and reach your full potential in your field. Don't miss out - subscribe today and ensure you're always informed, educated, and inspired.
Choose your newsletter(s)


