How drones and photogrammetry can support the energy transition
Calculating access to solar energy in low-density residential areas
Improved understanding of the amount of solar energy that could be gathered directly from roofs can support the complex task of transitioning existing low-density residential areas to renewable energies. A London-based team have created a novel workflow using drone technology and photogrammetry to estimate the amount of solar energy that can be captured in urban environments.
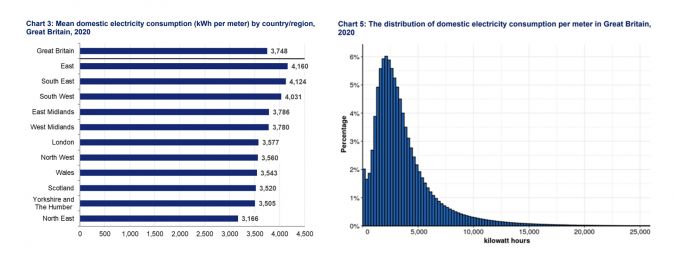
To fulfil the Paris Agreement, keep global warming below 1.5⁰C and achieve ‘net zero’ in 2050, CO2 emissions in residential areas must be reduced by at least 78% over the following decade. In 2020, according to the Sub National Electricity and Gas Consumption Statistics Report provided by the Department of Business Energy and Industrial Strategy, the mean annual domestic electricity consumption in Great Britain was 3,750kWh, while the median domestic electricity consumption was 2,900kWh (Figure 2). However, according to the British Climate Change Committee, around 29 million UK homes have outdated construction systems and are responsible for wasting vast amounts of energy on heating and/or cooling throughout the year. Solar energy can play a crucial role when retrofitting those homes to help them achieve a considerable percentage of their energy requirement from renewables directly on site.
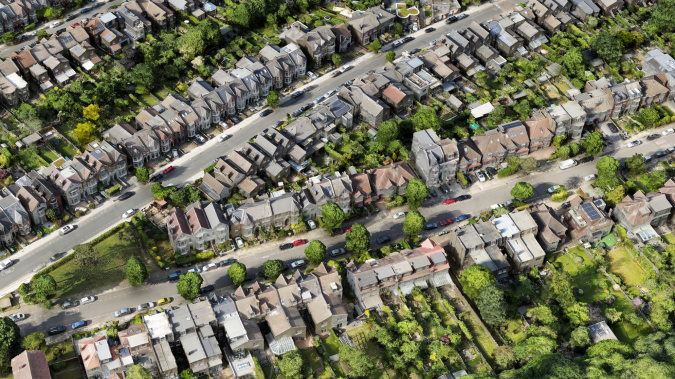
The team at London-based architectural consultancy studio WDS-LAB conducted a study to estimate the amount of solar energy that can be captured in urban environments. The team relied on unmanned aerial vehicle (UAV or ‘drone’) imagery for this study because it is an affordable solution. Moreover, it enables 3D photogrammetry models with higher resolution and accuracy than satellite imagery does. 3D mesh model accuracy was an important factor in this project in order to construct an accurate model of the residential buildings and obtain the right inclination of the roofs in order to calculate how much solar energy would reach them. This was done using the appropriate geometry classification method. Once the solar photovoltaic panel specifications are known, it is possible to accurately forecast the amount of electricity generated by a solar panel array per month. This information is potentially interesting for local councils and other government authorities as well as homeowners. The initial test studies were carried out over neighbourhoods in London, but in theory this survey technique can be applied anywhere in the world.
Generating the 3D photogrammetry model
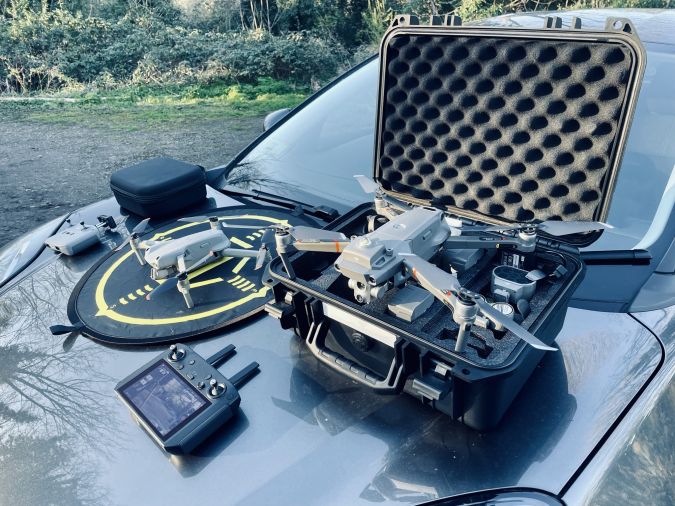
The methodology developed by WDS-LAB to quantify the energy reaching the roofs considers the amount of area that could be suitable for fitting commercial rectangular photovoltaic (PV) panel arrays. For the purpose of producing the photogrammetry model, a commercial DJI Enterprise Advanced drone was used equipped with a dual lens: one lens for the thermal spectrum and one for the visible light spectrum (which was able to obtain 48MP images). The procedure to capture images for the photogrammetry model relied on creating a preprogrammed drone mapping flight mission so that images could be gathered automatically with a uniform distribution and a zenith camera angle. The high resolution of the drone optics meant that the drone could be flown at the maximum altitude of 120m, in line with the airspace regulations in London, allowing coverage of a wider area in less time.
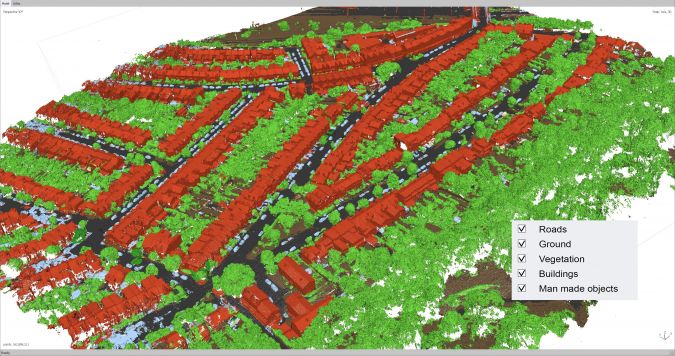
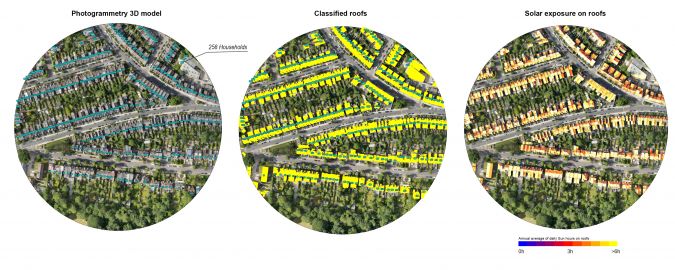
After gathering the image dataset, the team assembled the images using the Agisoft Metashape photogrammetry software and obtained a detailed textured 3D model. Using the machine learning algorithm for automatic point cloud classification, it was possible to separate the buildings from all other features (e.g. trees, streets and ground elements), which simplified the subsequent steps of running solar exposure analysis on the roof geometry.
Custom solar analysis algorithms
Due to the architectural background of the WDS-LAB team, they relied on 3D mesh modelling tools outside of the typical surveying software realm. Rhinoceros 3D was used since it is common among architects and urban designers. It allows 3D mesh treatment, rendering and texture visualization. It is also equipped with an impressive visual programming platform that allows the creation of complex algorithms for 3D environmental data analysis (Grasshopper 3D) with local weather databases taken into consideration.
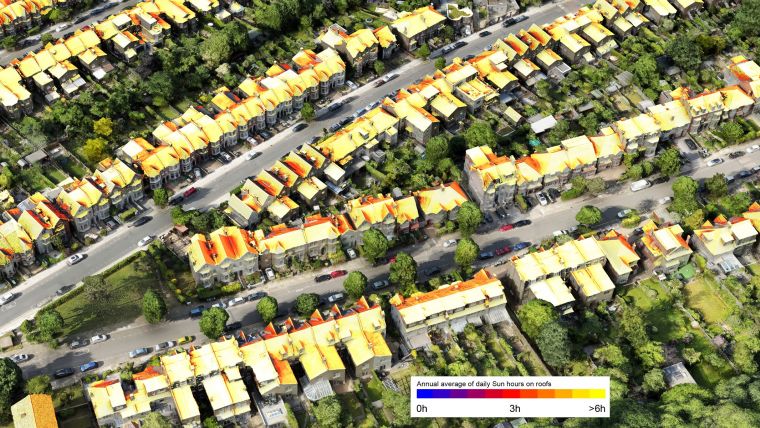
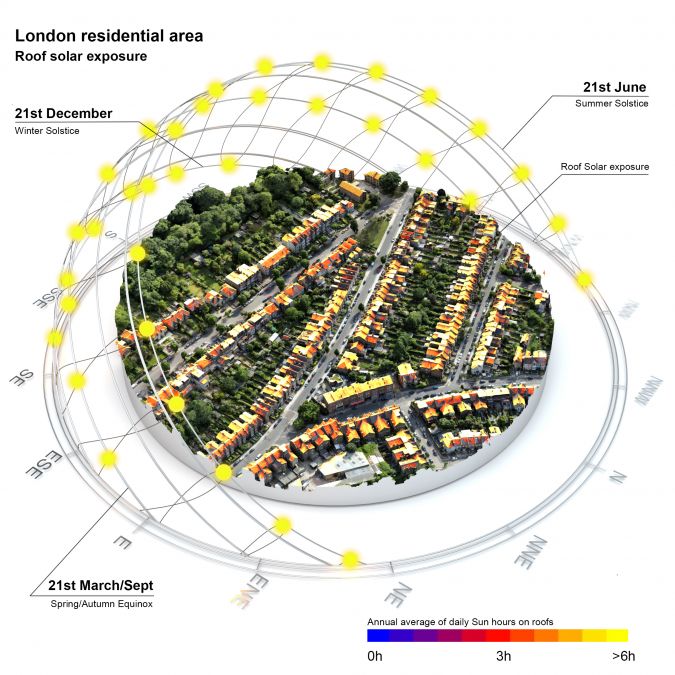
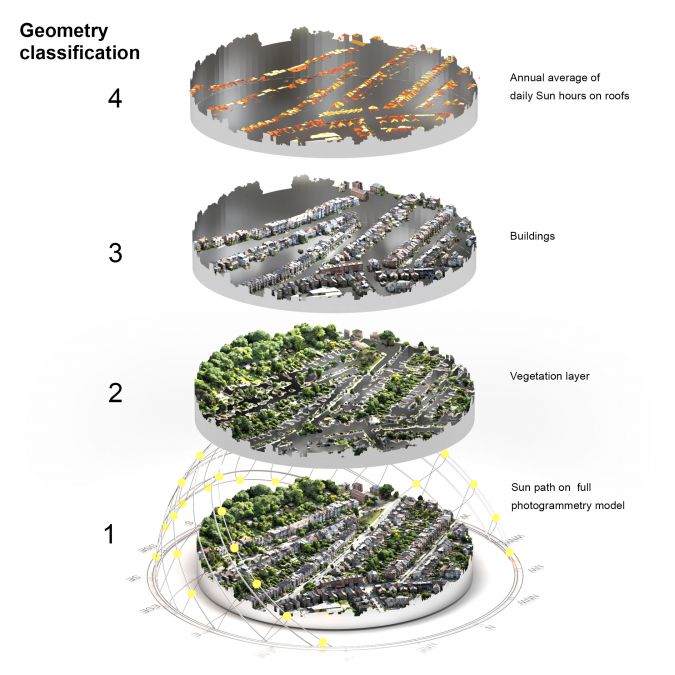
The resulting algorithms were able to automatically slice the mesh and classify the roof geometries, separating them from the rest of the building surfaces. This reduced the number of polygons that needed to be analysed by the solar analysis engine. Solar access analysis quantified how many hours of sun and incident solar radiation a geometry could receive in a given time period and calculated its accumulation in each mesh face. This process took into account hourly global horizontal irradiance values and the shadows that any adjacent element could cast on them. It was a computationally heavy operation, but the slicing and classification made the whole analysis process much faster than trying to analyse everything at once.
Calculating the area for solar panels on a roof
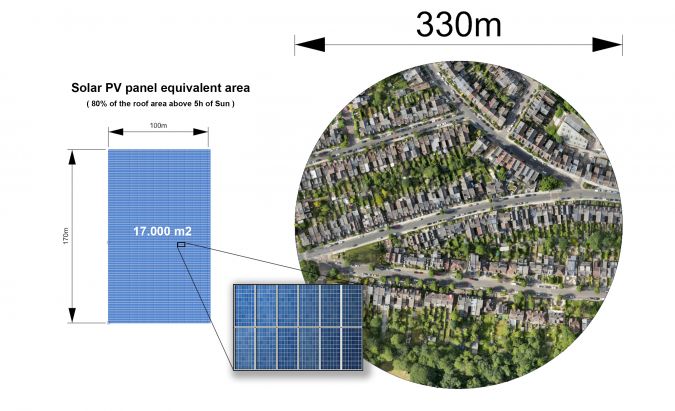
Residential roofs often have irregularities such as chimneys and telecommunication features or other elements that could make it difficult to integrate commercial rectangular solar panels measuring 1x1.7m. Nevertheless, it was estimated that 80% of the roof surfaces would be geometrically suitable for allocating PV panels, which meant that a total area of 17,000m2 of solar panels could be fitted on the roofs in the sampled neighbourhood (Figure 6).
Calculating the solar energy contribution from solar panels
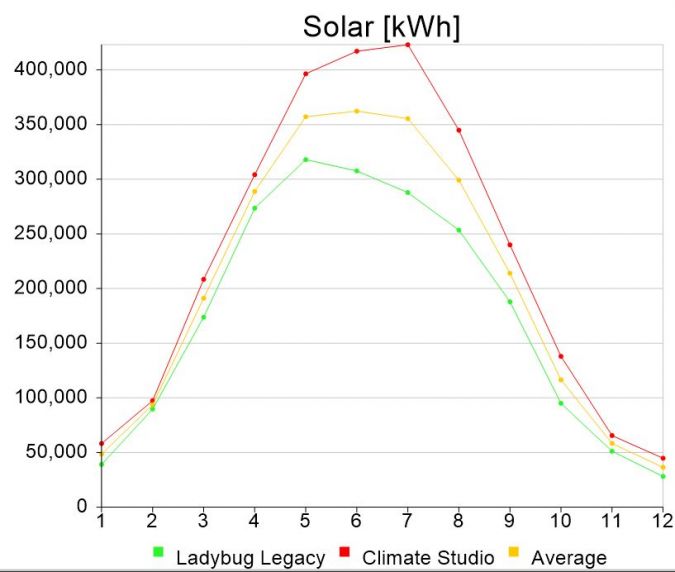
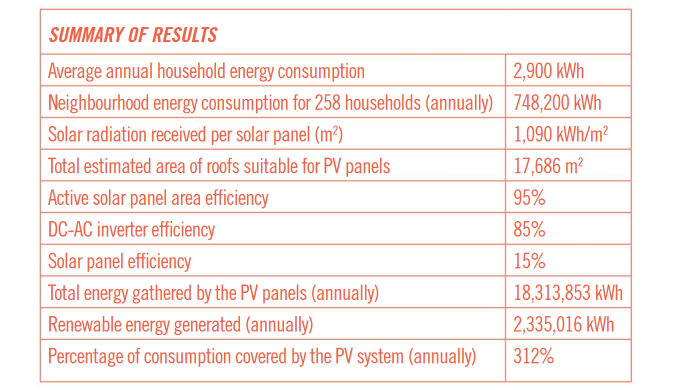
For this study, the team used standard databases for solar photovoltaic panels and assumed the values that can be seen in Figure 11. The calculations of the energy produced annually showed that the whole array of solar panels, if placed horizontally looking upwards, would receive a total of 2,335,016kWh of energy. Based on the annual median household consumption in Great Britain according to the Department of Business Energy and Industrial Strategy (2,900kWh per year per household), this amount of solar energy gathered directly from the roofs would be able to power 800 households annually, providing that batteries were used to store the energy for use at nighttime. Since the sampled neighbourhood had 258 residences, it was concluded that the roofs could gather an estimated three times the amount of energy needed from solar if the energy produced throughout the year could be accumulated.
Conclusions
The use of architectural environmental simulation tools on photogrammetric models captured with drones has proven to be a fast and reliable system that can help energy assessors and architects to better understand the potential for locally tapping into renewable energy sources in urban environments. Thanks to this experimental workflow, WDS-LAB estimates that PVs allocated on the roofs of a neighbourhood like the one studied could generate more energy from renewables than needed. Excess energy could be used to power other buildings and create a balance with other areas with higher residential density, thus helping a city like London to reduce its carbon footprint.
Drones and photogrammetry are great tools for studying new ways to integrate renewables in urban contexts, helping to obtain more accurate geometries and consider the existing ‘as-built’ situation. This brings more accuracy to the process than when using simplified massing CAD models available online from different organizations. These are not updated regularly and generally do not consider potential alterations on the surfaces of buildings and surrounding context elements.
The WDS-LAB team will continue to study more urban areas to expand the database and evaluate the full potential that London neighbourhoods could have for the installation of PV panels to help the city transition to renewables. There is no doubt that urban solar energy will play an important role in reducing carbon emissions. Studies like this help to raise awareness that the roofs of people’s homes can offer valuable access to renewable energy.


Value staying current with geomatics?
Stay on the map with our expertly curated newsletters.
We provide educational insights, industry updates, and inspiring stories to help you learn, grow, and reach your full potential in your field. Don't miss out - subscribe today and ensure you're always informed, educated, and inspired.
Choose your newsletter(s)


