Innovation Drives the Continuous Evolution of Data Visualization
Data visualization is inherent to humans and continuously evolves, driven by innovation. How is GIS playing a role in this? The term 'data visualization' has come into popular usage relatively recently, but the concept actually goes back to the earliest days of humans many thousands of years ago: from the first people scratching out their location in relation to food sources or one another. Needless to say, the expression of data visualization has changed and evolved many times through the ages, accelerating with each new related technological innovation.
Data visualization is an inherent human trait because our survival depends on it for food, trade and security. We can see this throughout history. The first people sketched the relative locations of food and water sources and other geographic features and phenomena, initially on the ground. As they developed tools and pigments, they illustrated this information on cave walls, some of which are still preserved today around the world. Land boundaries were demarcated with monuments, and physical descriptions were verbally communicated to establish geographic locations for land ownership. Chapters 13-21 in the Book of Joshua in the Old Testament Bible and Jewish Scriptures, from approximately 1400 BCE, contain a detailed description of the boundaries of the 12 tribes in enough detail that they have been placed on maps with a fair level of accuracy. Since then, Arab, Asian, Mediterranean and Polynesian sailors have navigated with instruments to ply trade routes thousands of miles from home.
The invention of papyrus and paper enabled geographic data to be visualized better, faster and cheaper. This important innovation led to the development and use of maps as we know them today, and cartography emerged as the prominent way to visualize location data. Travel for warfare, pilgrimages and trade further drove the development of mapping. Exploration in the 14th and 15th centuries exploded the need for mapping and catapulted the ancient marine navigation techniques onto rhumb lines, or Portolan charts, which evolved into modern-day nautical charts. The invention of the printing press allowed cartographers and printers to meet the growing appetite for maps to visualize the data coming back from the New World with every voyage. Innovations in shipping allowed for circumnavigation of the Earth, and a new kind of data visualization was required with terrestrial globes, celestial globes and armillary spheres to visualize the Earth and stars in 3D. The age of exploration was quickly followed by the ‘golden age’ of cartography to meet the visualization needs of the ensuing global trade that emerged and location data at these terminals. In the 18th and 19th centuries, many innovations in measurement and surveying led to a higher level of accuracy and larger-scale mapping, which dramatically improved data visualization at new scales.
Imagery and GIS Changed Everything
In the 20th century, visualization of geography changed dramatically with the invention of the aeroplane that was quickly adopted by many nations’ militaries. They put cameras on board and intelligence, surveillance and reconnaissance (ISR), as well as visualization of geographic data. Imagery joined mapping as one of the key geographic and cultural visualization tools. Mapping itself was changed forever as imagery became the primary source for change detection and feature mapping. This accelerated the need to map more quickly, and innovations in photomechanical reproduction methods began to replace hand-drawn maps.
In the 1960s, technological innovations enabled computer-assisted cartography and geographic information systems (GIS) to revolutionize how data was visualized and analysed. Data was no longer compiled and produced for a single point in time, only to quickly degrade. Instead, the results of efforts to capture and produce the map data could now be stored in computers, which allowed the data to be updated and continually reused. As this process was further refined in the 1970s and 1980s, organizations were able to free up resources to leverage the data for many different uses.
I learned this first-hand in 1992, when I started using GIS as a production manager at a Silicon Valley start-up that was on its way to becoming the largest provider of routing map data for in-vehicle navigation systems and eventually the internet. Automotive manufacturers around the globe wanted the data to deliver turn-by-turn instructions to drivers. However, the data itself was not enough. The car companies were not successful until we provided the cartographic attributes in the data model to allow each company to visually render a map to their specifications. In a very short time we enabled many different automotive companies to each visualize the data uniquely to their brand. The map data we created was consumed and visualized by many different organizations and in many different cartographic styles. That same map data was used for cartographic paper maps and digital maps that eventually went into apps and web services.

Innovating with Location Data
While we were using GIS on cutting-edge technology in Silicon Valley, the rest of the world was beginning to discover GIS for many different applications. It is a widely accepted fact that 80-90% of the data around the globe has an underutilized location component. GIS leverages that location data attribute and enables the data to be visualized and analysed to derive additional value and uses. Even non-GIS people can take advantage of their data by visualizing it in dashboards and further analysing it to discover new insights using a simple but powerful browser-based GIS app.
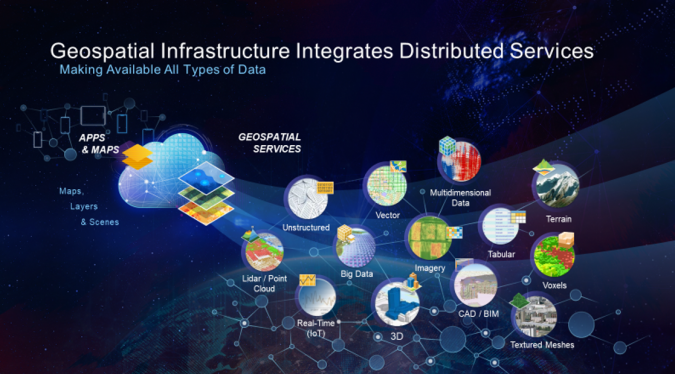
Data can now be created, visualized, analysed and utilized in apps in desktop, enterprise, mobile, web and cloud GIS environments. The data can be shared easily, integrated harmoniously and add value to applications across a myriad of government and industry activities, covering thousands of use cases. The different types of data are as diverse as vector, imagery, Lidar/point clouds, terrain, 3D, textured mesh and multidimensional data, voxels, CAD/BIM, tabular and unstructured, big data and real-time (IoT) (see Figure 1).
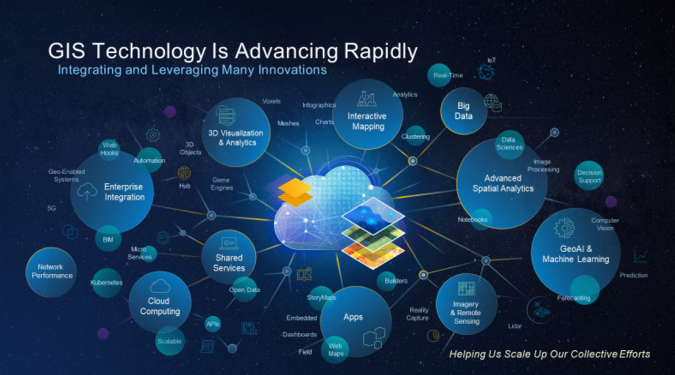
Increasingly, GIS is being used to make sense of the exploding volume, velocity, veracity and variety of data coming at us every day. GIS allows us to do geoprocessing of big data in the cloud utilizing containerization and microservices. GIS with AI and deep learning, or ‘geoAI’, enables us to data mine this big data to quickly perform change detection and identify, classify and extract information. This gives us the ability to keep up with the blizzard of data coming from imagery and remotely sensed data services streaming from satellite, airborne, terrestrial, marine and drone platforms (see Figure 2).

How to Make Data Actionable
So the inevitable question is, how do we make all of this data actionable? In his book titled Information Anxiety, Richard Saul Wurman (founder of TED Talk and TED Conference) wrote: “To deal with the increasing onslaught of data, it is imperative to distinguish between data and information. Information must be that which leads to understanding.” And as he has famously stated, “Understanding precedes action.”
GIS enables us to visualize our data and turn it into information using geospatial analysis. With human interaction and innovation, that information can be transformed into knowledge, insight and understanding as the basis for more effective actions and decisions. Today’s mapping and geospatial authorities play a key role in this.
Further Reading
Innovating with Data, Brent Jones, Esri
Understanding Precedes Action – And Geography Maps the Course (including quotes by Richard Saul Wurman)

Value staying current with geomatics?
Stay on the map with our expertly curated newsletters.
We provide educational insights, industry updates, and inspiring stories to help you learn, grow, and reach your full potential in your field. Don't miss out - subscribe today and ensure you're always informed, educated, and inspired.
Choose your newsletter(s)


