Lidar deep learning for ancient Maya archaeology
Automating the identification of hidden archaeological sites using 3D point clouds
While it is possible to capture ancient Maya sites hidden beneath jungle canopy in remote locations using airborne Lidar, identifying them is still a time-consuming process. Typically, 3D point clouds are converted to 2D topographic relief images that tend to miss smaller archaeological mounds that are critical to understanding human-environment interactions with implications for today’s global challenges. This project directly analysed Lidar data using deep learning to dramatically speed up the processing time and increase the accuracy of archaeological site identification.
In the past decade, airborne Lidar has captured thousands of previously undocumented ancient Maya archaeological features, confirming the vast scale of classic (250–800CE) Maya cities. However, archaeologists face two major challenges. First, there is a deluge of Lidar data that requires significant and costly manual labour to interpret. Second, automated and manual data processing techniques still miss nearly 50% of small archaeological mounds due to topography and variations in vegetation height and density.
Previous research
To address the first challenge, a few archaeologists started to employ deep learning, a sub-field of machine learning, which has demonstrated state-of-the-art performance on automated object recognition tasks. While successful, this previous research was limited to the application of deep learning to 2D data, excluding available 3D data, and did not focus on smaller archaeological features. This project is unique because it addresses this gap using deep learning-based processes that can classify archaeological sites directly from Lidar 3D point cloud datasets and improve the accuracy of identifying small archaeological features beneath deep canopy in diverse environmental conditions.
Case study
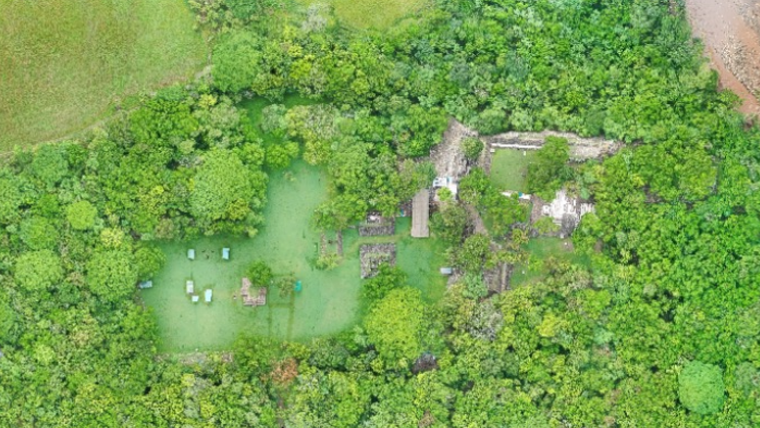
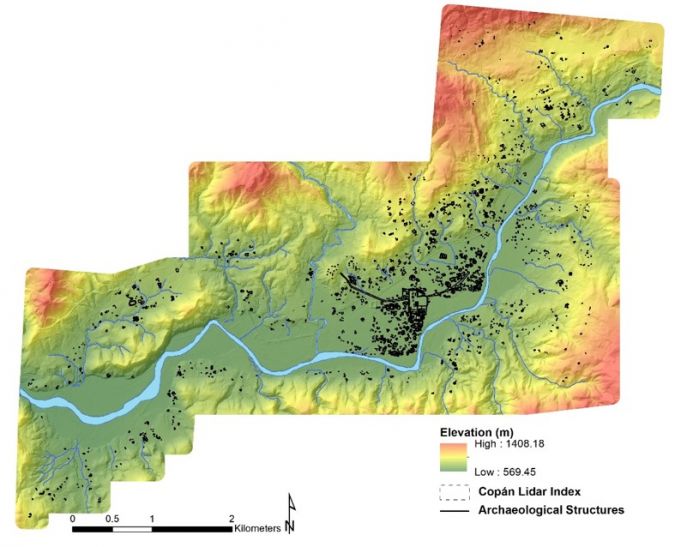
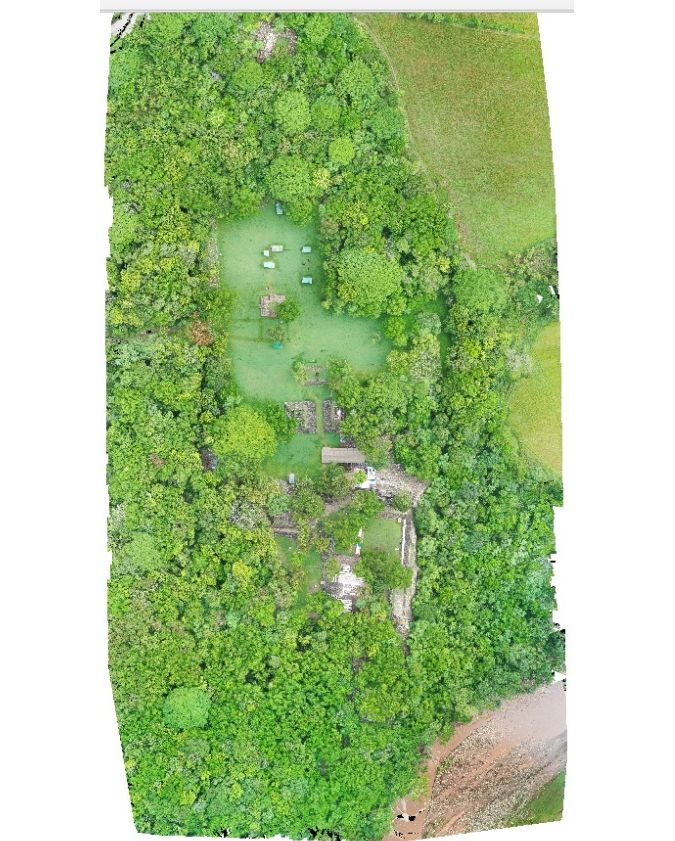
Lidar data from the UNESCO World Heritage Site of Copan (Figure 1 and 2) Honduras, was used as the primary dataset to develop new deep learning models and subsequently compare the classification accuracy of deep learning models using 2D and 3D data. From the fifth to ninth centuries CE, Copan – often referred to as the ‘Athens of the Maya World’ – was the cultural and commercial centre of a powerful ancient Maya kingdom. The city has awed explorers, archaeologists and visitors since the 1500s and is the most thoroughly excavated Maya site. In 427CE, Yax Kuk Mo became Copan’s first dynastic ruler, founding a dynasty that encompassed 16 rulers and spanned almost 400 years until succumbing to environmental and sociopolitical pressures that befell the kingdoms of the Maya Southern Lowlands. Copan’s location in a narrow valley with altitudes ranging from 569–1,408m along the Copan River results in varied topography, diverse vegetation and varied land-use practices, and is therefore representative of the challenges faced across the Maya region in identifying archaeological sites from Lidar.
Project data: archaeological and Lidar
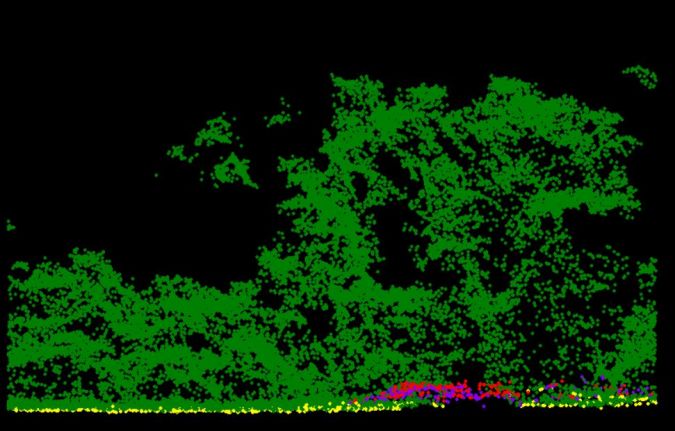
In the late 1970s and early 1980s, the Copan Archaeological Project carried out a simple mapping survey using a plane table and alidade, over 25km2 around Copan’s main civic-ceremonial centre. The analogue maps were georeferenced and digitized to establish a Copan Geographic Information System (GIS). In 2013, the MayaArch3D Project captured Lidar data for the same spatial extent using a Leica ALS50 Phase II system mounted on a Piper Aztec aircraft. The target point density was ≥ 15 pulses/m2 and all areas were surveyed with an opposing flight line sidelap overlap of ≥ 50%. The average first-return density was 21.57 points/m2 and the ground return density averaged 2.91 points/m2. Following acquisition, the Lidar data went through several (time-consuming) stages of post-processing that incorporated ‘standard’ bare-earth algorithms and semi-automatic and manual methods to classify 3D points into four classes: (1) Vegetation (green), (2) Ground (yellow), (3) Archaeological Features (red), and (4) Ruin Grounds (purple) (see von Schwerin et al., 2016) (Figure 3).
Deep Learning: Object Classification and Semantic Segmentation
For decades, computer vision specialists have studied the problem of automating object classification and semantic segmentation. Convolutional neural networks (CNNs) have proven most successful; however, they require large amounts of labelled training data, often in the range of millions of images that are pre-labelled and/or segmented by hand. This poses a difficulty when working with small datasets, typical of remote sensing and, in particular, archaeology. Previous research suggests that the application of transfer learning – a machine learning method that improves performance using knowledge learned from a previous task – for small datasets improves model accuracy. In terms of 3D shape classification, point-based methods have demonstrated some of the highest accuracy; thus, this research used a point-based transfer learning architecture to identify ancient Maya archaeological sites.
Method
The PointConv (Wu, Qi and Fuxin, 2019) deep learning architecture was employed to identify ancient Maya archaeological sites from Copan’s Lidar data. The method was tested against CNN processes relying on 2D data, using Inception-v3, to determine the most effective approach. In addition, data augmentation strategies for working with small 3D datasets were evaluated. The results of these experiments demonstrate that the PointConv architecture provides greater classification accuracy in identifying Maya archaeological sites than the CNN-based approach. This result demonstrates a path for researchers to make use of 3D point cloud data directly in deep learning models while improving accuracy and reducing data preparation time.
Dataset pre-processing
For the 3D model training, raw laser (LAS) formatted files were used from shapefiles annotated by the archaeologists. Then, 10,024 points for each input data file were uniformly sampled and the normal vectors were computed from the point clouds. The primary parameters for the point cloud data include XYZ coordinates and normal vectors using CloudCompare. For the 2D comparison, hillshade images were labelled and divided into two sets of sub-images: (1) positive class: archaeological structures and (2) negative class: areas without archaeological structures. Both subsets included background comprising 3D points representing diverse topography and vegetation type and density.
Data augmentation and training 3D and 2D deep learning models
Large amounts of data are needed to train deep learning models, but the Copan dataset was not large enough; therefore, two data augmentation methods artificially generated new data from the existing data to create a larger and more variable dataset: (1) random rotation and (2) jittering via Gaussian noise. The same data augmentation strategies were employed for the 3D and 2D models. The 3D training dataset comprised 142 positive samples (containing archaeological sites) and 142 negative samples (only natural features). The 2D training dataset comprised 410 positive samples and 430 negative samples with a variety of hills, mountains and flat areas (vegetation was removed because it obscures sites). Through data augmentation, the dataset size was tripled for both 3D and 2D model training. For 3D and 2D model training, 80% of the dataset was used, and the remaining 20% was used for testing.
Results
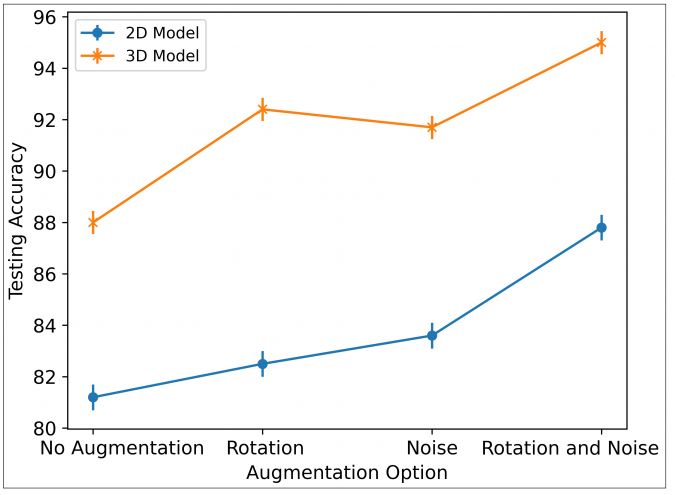
The 3D and 2D deep learning models were evaluated based on the accuracy of the test datasets, which were not used for training. Additionally, the models were evaluated based on augmentation methods. Figure 4 shows the classification accuracy of the augmentation methods. The 3D model achieved 88% accuracy on the testing data without augmentation, 91.7% using a Gaussian noise-based approach, 92.4% using random rotations, and 95% accuracy with combined augmentation. In comparison, the 2D model was only able to achieve an accuracy of 87.8% using this same combined augmentation strategy. In part, the success of the 3D deep learning results from the inclusion of Z elevations, unlike the 2D hillshade images.
Conclusion and future work
While airborne Lidar is transforming archaeology, identifying archaeological sites is still extremely time-consuming and expensive because standard filtering algorithms tend to fall short. In the Maya region, this task is particularly challenging because sites are hidden below jungle canopy and appear as mounds that are difficult to distinguish from natural topography. To date, only a few deep learning projects have been applied to archaeology, and these have employed 2D approaches. In contrast, this project illustrates that raw 3D point cloud data can not only be used in deep learning approaches but provides higher accuracy in identifying ancient Maya sites of all shapes and sizes. Future work will refine the employed methods and incorporate a larger dataset of ancient Maya sites from Belize to continue to disentangle the impacts of variable topography and vegetation not only for deep learning approaches but also for understanding what we can learn from ancient environmental engineering.

Value staying current with geomatics?
Stay on the map with our expertly curated newsletters.
We provide educational insights, industry updates, and inspiring stories to help you learn, grow, and reach your full potential in your field. Don't miss out - subscribe today and ensure you're always informed, educated, and inspired.
Choose your newsletter(s)


