Maps and Apps to Monitor, Prepare for and Respond to COVID-19
Over the last few weeks, coronavirus (COVID-19) has spread all over the world. Countries such as China, Italy and Spain are particularly impacted, but almost every country across the globe is affected by the pandemic in some way. Esri is helping the community at large with location intelligence, geographic information system (GIS) and mapping software, services and materials for monitoring, preparing for and responding to the impact of the outbreak. ArcGIS dashboards are being widely used to visualize and monitor the spread of the virus in local communities, provinces, states, countries and worldwide.
Billions of Views
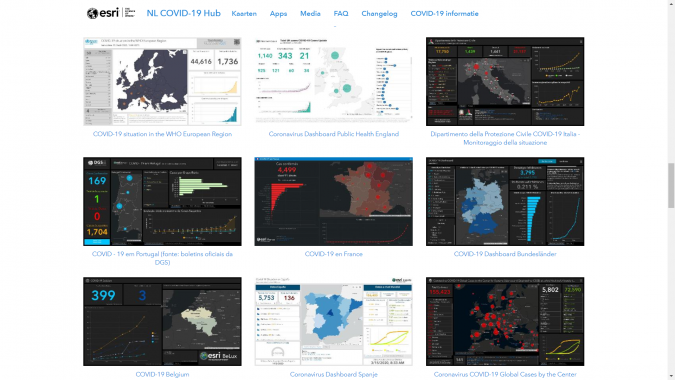
The maps and apps are used by governmental institutions, emergency services such as the police and medical care institutions, research institutes and the media. One of the most used dashboards is the one created by the Johns Hopkins University in collaboration with Esri that keeps track of the number of infections and deaths and recoveries per country. As part of the Esri Disaster Response Program, Esri teams all over the world have created COVID-19-related maps and apps that together have had billions of views.
Esri Disaster Response Program
The Esri Disaster Response Program is not new. For over 20 years, this Esri initiative has provided complementary support to current GIS users and the community during disasters and crises, from 11 September, Hurricane Katrina and MH-17 to the recent wildfires in Australia and now this global crisis. Esri is offering its free support with technology and help from GIS experts to support organizations that are dealing with COVID-19.
Contribution to Society
Esri Nederland director Jurgen ten Siethof explains why Esri is doing this: “The life purpose of Jack Dangermond, Esri’s founder and CEO, is to help people around the world to make better decisions using authoritative geographic data and GIS technology. This mission is something that all Esri employees are passionate about.” A Disaster Response Team for this crisis was easily formed in each country and people are working very hard to constantly update and improve all the maps and apps.
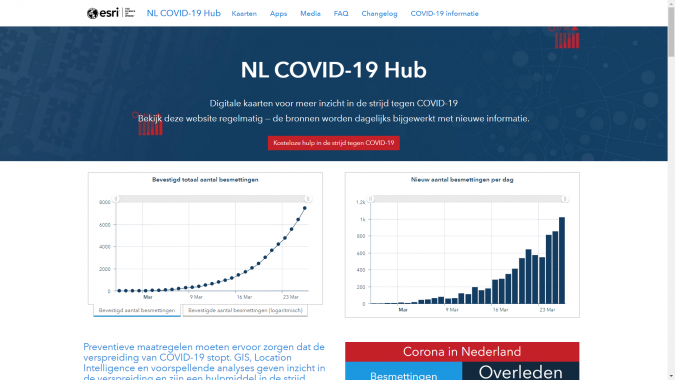
Dutch COVID-19 Hub
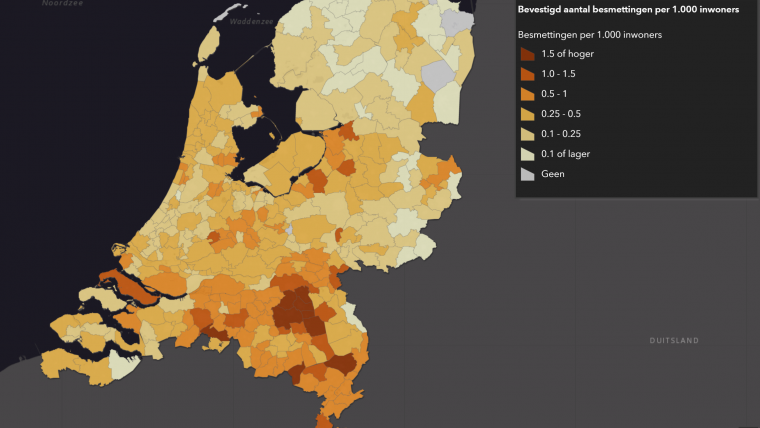
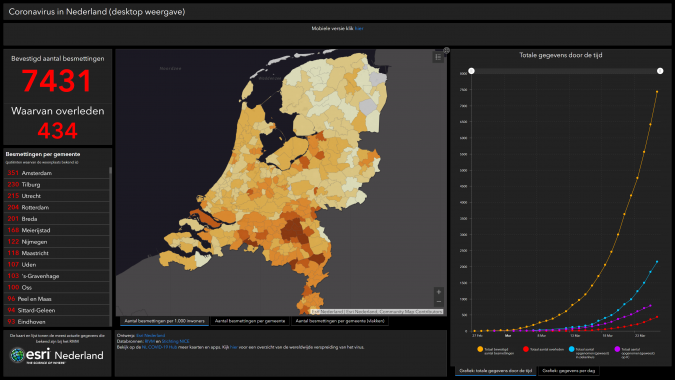
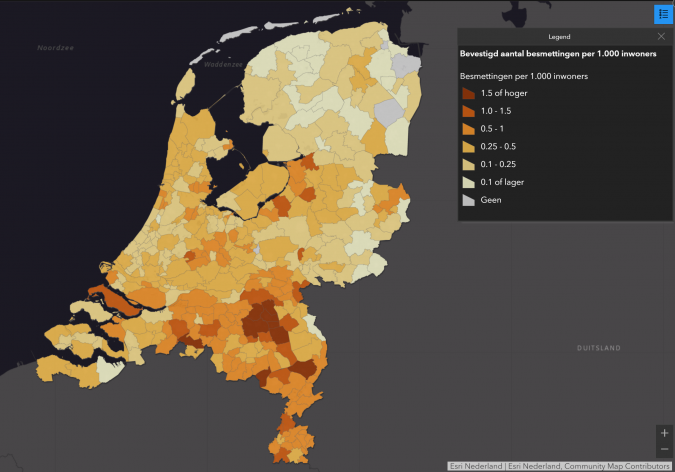
In the Netherlands, the Dutch Disaster Response Team is led by Joris Bak. Within 24 hours, he and his team created esri.nl/corona with several maps and apps. For example, there is information about the number of infections and deaths by municipality, province, safety region and GGD (healthcare organization) area. There are graphs showing the infections day-by-day and the locations with vulnerable people are mapped as well. Several maps are also shared with the media so that they can easily report on the current situation.
Joris Bak explains: “We all see how busy a lot of institutions and organizations in the Netherlands are, trying to help people that are infected and to avoid the virus spreading across the country. With this COVID-19 hub, we are trying to help them so that they can focus on making the decisions instead of collecting data and information. Working with ArcGIS is our daily work and expertise, and hopefully with this hub we can help our society deal with this disease.”
Joris goes on to explain: “This COVID-19 collaboration hub is only possible because of the good open-source data quality in the Netherlands and the willingness of several government organizations and businesses in our country to work together and share their data for this purpose. I can only say ‘thank you’ to all the people and organizations that have reached out to us to help with sharing data and information. Working together in this situation is very important and shows the Dutch solidarity.”
The Dutch COVID-19 hub is updated every day with new data, apps and maps. The Dutch Disaster Response Team can be reached by email (corona@esri.nl) and the page can be visited on esri.nl/corona. If your organization is also looking for support in your country, please see here for more information on how to get in touch with Esri.

Value staying current with geomatics?
Stay on the map with our expertly curated newsletters.
We provide educational insights, industry updates, and inspiring stories to help you learn, grow, and reach your full potential in your field. Don't miss out - subscribe today and ensure you're always informed, educated, and inspired.
Choose your newsletter(s)


