Mobile Laser Scanning Point Clouds
Automatic 3D Mapping of Road Objects
This article was originally published in Geomatics World.
The demand for 3D maps of cities and road networks is steadily increasing and mobile mapping systems are often the preferred acquisition method for capturing such scenes. Manual processing of point clouds is labour intensive and thus time consuming and expensive. This article focuses on the state of the art of automatic classification and 3D mapping of road objects from point clouds acquired by mobile mapping systems and considers the feasibility of exploiting scene knowledge to increase the robustness of classification.
Management of roads requires inventories on pavement conditions, road markings and objects in the vicinity of the road including utility poles, traffic signs and lamp posts. The high point density of point clouds acquired by mobile mapping systems (MMSs) allows mapping of traffic guidance arrows and road lines painted on the pavement, vertical road objects, cracks and holes in the pavement, cavity and sagging. Vertical road objects are known as pole-like objects (PLOs), because of their profoundly elongated shape usually extending in a vertical direction. While carrying out the survey at traffic speed, there is no interference with other road users, which contributes to safety. As a result, MMSs have evolved into an increasingly popular acquisition technology for conducting road inventories over the last 15 years.
Mobile Mapping Systems
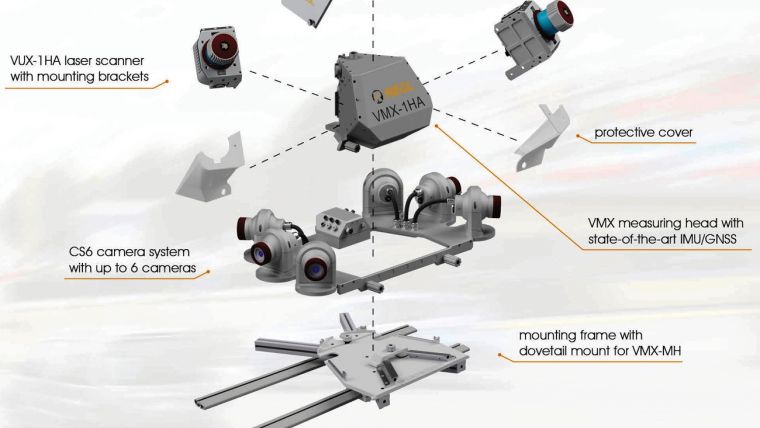
A Mobile Mapping System is usually mounted on a vehicle that can move with traffic speed over roads and highways. An MMS consists of a positioning and orientation system (POS), one or more laser scanners, one or more digital cameras and a control unit. The setup of an MMS is shown in figure 1. The part of the MMS without cameras is called the Mobile Laser Scanning (MLS) system. The POS continuously acquires data for calculating the exterior orientation parameters (three coordinates and three attitude angles) using a GNSS receiver and an Inertial Measurement Unit (IMU), often complemented with a wheel rotation counter. Each laser scanner emits pulses, presently up to one million pulses per second, to capture road surfaces and objects above and alongside the road. From the pulse travel times the distances between sensor and object is calculated.
The laser scanner primarily measures range; scan angle and intensity of the return. Combining these measurements with those from a GNSS receiver, IMU and wheel counter provides 3D coordinates of millions or even billions of points in a local or national reference system. Usually the sensors are integrated on one rigid platform of which the mutual offsets have to be calibrated. This is usually done by the manufacturer. Vibrations during the survey due to holes in the pavement and sudden slowdowns will cause mutual displacements of the sensors and other disturbances. To warrant high-precision surveys at all times, regular recalibration is required. In addition to the 3D coordinates, one or more attributes may be assigned to each point. The attributes may be directly measured by the sensor, this relates particularly to the intensity of the return, computed from a neighbourhood of points or obtained from other sources. RGB values may be assigned to laser points using the simultaneously recorded digital images or image sources having other time stamps. Attributes act as features for automatic object recognition.
Automatic Object Recognition
The demand for automated mapping methods has been a great stimulus for research in photogrammetry, remote sensing and computer vision over the last decade. The classification of point clouds is directed towards 3D mapping, that is, the outlining of objects within the road scenes which are of interest for a particular task at hand and the assignment of class labels to these objects. The pipeline of automated classification and mapping of road scenes usually starts with separating ground points from off-ground points. Figure 2 depicts a typical pipeline, which has been recently proposed by Yang et al. (2017). If mapping road surfaces and road markings is not part of the survey, separation of ground points from off-ground points results in a great reduction of points in the process.
The next steps depend on the type of scene and the preferences of the researchers. The diverse approaches can be categorised into three main groups: point-wise classification, segmentation-based classification and multiscale classification. Point-wise classification exploits the intensity of the return and/or the shape and other geometric properties in the vicinity of each point. The geometric features are assigned to each of the individual points, which then are grouped and classified. Segmentation-based methods fit planes, spheres, cylinders or other geometric primitives through neighbourhoods of points. The descriptive parameters of these segments are used as features for further grouping, classification and mapping.
The three categories discussed above heavily rely on the computation of geometric features through exploiting the local geometric structure. Automated classification attempts on MLS point clouds have mainly focused on assigning pre-specified classes to individual points. Point-based approaches are more robust to occlusion and clutter compared to the segmentation-based approaches but the latter are more robust to noise and varying point densities. As a result, point-based approaches may suffer from assigning wrong classes to the individual points. However, segmentation based methods may also produce erroneous results because of their sensitivity to occlusion and clutter. Occlusion means that a part of an object is not visible from the sensor position due to the presence of another object in the line-of-sight. An example of clutter is the mixing of segments belonging to one object with segments of another object which is closely attached to the object or overlaps it.
Local Geometric Structure
In addition to the 3D coordinates in a local, national or regional reference system, usually only the reflectance value of each point – often represented as a digital number in the range from 0 to 255 – is available in a point cloud. As a result, many classification approaches rely on enriching the attribute set with RGB values from imagery, which may not always be available, and on examining the local geometric structure of a set of neighbouring points. The suitability of the local geometric structure is based on the observation that many objects differ in shape. For example, the majority of buildings can be modelled as an ensemble of planes which, in most cases, intersect perpendicularly at corner lines, while power lines can be modelled as linear elements.
There are two basic descriptors to express the shape of a surface: normal vectors and eigenvalues. Both are assigned to individual points by examining the configuration of the point under consideration and its adjacent points. So, the computation of normal vectors and eigenvalues is done by examining the 3D coordinates of a neighbourhood of points. If the normal vectors of neighbouring points point in the same direction, the local neighbourhood likely form a plane. If they diverge in a systematic manner they are likely to form a sphere or a cylinder. When no systematics in directions are present, the points may be reflected on a fuzzy surface, such as foliage.
Also eigenvalues of the 3x3 covariance matrix of the three coordinates of neighbouring points indicate shape. If one eigenvalue is large and the other two close to zero, the neighbourhood forms a line. A plane is indicated by two eigenvalues which have approximately the same value and one eigenvalue close to zero. Spherical and fuzzy surfaces will have three large eigenvalues. It is common practice to derive measures from the eigenvalues which indicate the type of local structure. Examples of such measures are: linearity, planarity, sphericity, anisotropy, eigenentropy and local surface variation.
Deep Learning
Recent innovations in computer vision and AI include the development of deep learning algorithms based on Convolutional Neural Networks (CNNs). The development of this type of machine learning methods have been inspired by the working of the human brain. In popular science literature, it is often suggested that a CNN simulates the brain, but that is not true in the same way as it is false to state that an aeroplane would simulate the flight of birds. CNNs have been successfully applied in self-driving cars, robotics and object recognition from images. However, classification of point clouds appears to be a hard issue because of the sheer amount of points and the complexity of outdoor scenes. Added to this the points are not inherently structured as on an image raster while the distribution of points over space is irregular and non-homogenous.
By feeding a CNN with data of an abundance of prototype objects, the algorithm can recognise objects across a broad variety of scenes. However, the training data has to be manually selected, which is more time-costly for 3D models than for 2D models. Recently, ETH Zurich, Switzerland, has released a large-scale point cloud classification benchmark with over four billion manually labelled points, acquired with terrestrial laser scanners (semantic3d.net). The benchmark contains urban and rural scenes, captured in Central Europe, depicting typical European architecture including town halls, churches, railway stations, market squares and more (Figure 3). The benchmark is freely available and is a valuable source for testing the performance of existing or proposed classification pipelines.
Height Component
Indeed, because point clouds are limited in the number of attributes, which are directly observed during the survey, it is inevitable to explore a local neighbourhood in the class assignment process of individual points. In the case of 3D mapping of outdoor scenes, the heights above a reference surface, e.g. ground surface, are the most important asset of a point cloud and this information should by fully exploited. Of course, it is not feasible to explore the height above ground level itself as a height component. Many points reflected on traffic signs, façades, lamp posts, cars, pedestrians and trees all may have the same height. So, height above ground level weakly discriminates among the different classes and thus is not well-suited for classification.
An approach which may work is based on the observation that off-ground points of urban scenes collected by a MLS system are usually part of objects which extend in the vertical direction. One of the characteristics of these objects is that they have different heights. For example, a building facade varies in range which may start at seven metres, or higher, depending on the urban area, while the height of a traffic sign mounted on a pole from ground level upwards does usually not exceed three metres. The exploitation of the height component is subject of on-going research, see Zheng et al. (2017). Furthermore, scene knowledge can be exploited for checking and improving classification results.
Scene Knowledge
Different types of objects may have similar geometric features. As a consequence, when only using this type of feature the result may be prone to confusion in the class assignment process. To avoid, the classification only depending on the use of the 3D coordinates of a local neighbourhood of points, a priori scene knowledge can be introduced in the classification pipeline. Therefore, to improve classification results we can introduce scene-specific rule number one: roads and their vicinity are man-made, meaning that the placing of objects, their shape, size and orientation, have to obey road traffic regulations, master plans and other official restrictions. As a result road objects, such as guardrails and traffic signs, appear in zones which are approximately parallel to the main direction of the road, while the distance to the road only varies within a certain range. Added to this, the orientation of traffic signs mounted on poles is usually perpendicular to the road direction.
A second useful rule is that everything is connected to something else and ultimately to the surface of the Earth. This generic rule can be further specified in the form of a geometric constraint: road objects usually expand in the vertical direction, while their height lies within a specific range. Furthermore, the distribution of the number of returns from a traffic sign depends on its shape and size. Road objects are often placed in regular patterns. This knowledge can be used for improving assignment of classes. For example, along the road, lamp posts are placed at regular distances. Recently, Yang et al. (2017) used scene knowledge together with combining the point-based approach with the segment-based approach and found that their classification pipeline resulted in an improved class label assignment compared to other methods.
Concluding Remarks
Around the year 2003 mobile laser scanning systems became operational for surveying and 3D mapping of road scenes. Today MLS systems are used for capturing roads and their vicinity aimed at road inventories on a regular basis. In the meantime, interesting innovations are ongoing, one of these is increasing awareness that point clouds should be treated as a third type of data model along with raster and vector representations. The point acquisition rate, as well as the number of commercial MLS systems in operation, are steadily increasing. However, data is not yet information – the conversion requires careful processing of which the specifications of the various steps depend on the application domain as well as scene type. Before the sheer amount of points can be mapped fully automatically a long and winding road still lies ahead of us.
------------------------------
Acknowledgements
This article is a modified version of one published in GIM International in August 2017. Thanks are due to Prof. Konrad Schindler, ETH Zurich, Switzerland, for allowing the presentation of the semantic3d.net benchmark and providing valuable input for the Deep Learning paragraph.
Further Reading
Guan, H., Li, J., Cao, S., Yu, Y. (2016) Use of mobile LiDAR in road information inventory: a review, International Journal of Image and Data Fusion, 7(3), pp. 219-242, DOI: 10.1080/19479832.2016.1188860.
Yadav, M., Husain, A., Singh, A.K., Lohani, B. (2015) Pole-shaped object detection using mobile Lidar data in rural road environments, Annals of the Photogrammetry, Remote Sensing and Spatial Information Sciences, Volume II-3/W5, ISPRS Geospatial Week 2015, La Grande Motte, France.
Yang, B., Dong, Z., Liu, Y., Liang, F., Wang, Y. (2017) Computing multiple aggregation levels and contextual features for road facilities recognition using mobile laser scanning data, ISPRS Journal of Photogrammetry and Remote Sensing 126, pp. 180–194.
Yokoyama, H., Date, H., Kanai, S., Takeda, H. (2013) Detection and Classification of Pole-like Objects from Mobile Laser Scanning Data of Urban Environments, International Journal of CAD/CAM, Vol. 13, No. 2, pp. 31-40.
Zheng, M., Lemmens, M., van Oosterom, P. (2017) Classification of mobile laser scanning point clouds from height features, ISPRS Geospatial Week, 18-22 September, Wuhan, China.
This article was published in Geomatics World January/February 2018

Value staying current with geomatics?
Stay on the map with our expertly curated newsletters.
We provide educational insights, industry updates, and inspiring stories to help you learn, grow, and reach your full potential in your field. Don't miss out - subscribe today and ensure you're always informed, educated, and inspired.
Choose your newsletter(s)


