OBIA and Point Clouds
Airborne Lidar and Object-based Image Analysis
Is object-based image analysis (OBIA) suitable for the semi-automatic classification of Lidar point clouds? The propsects are certainly promising, as this article shows.
Object-based image analysis (OBIA) has been developed to improve the accuracy of conventional, pixel-based classification of multispectral images. Introduced around the year 2000 and implemented in various software packages such as eCognition, OBIA has been successfully applied for mapping land cover, forest and agricultural areas. Today, not only high-resolution multispectral images are available but increasingly also high-density 3D point clouds captured by airborne Lidar. So is OBIA also suitable for the semi-automatic classification of Lidar point clouds?
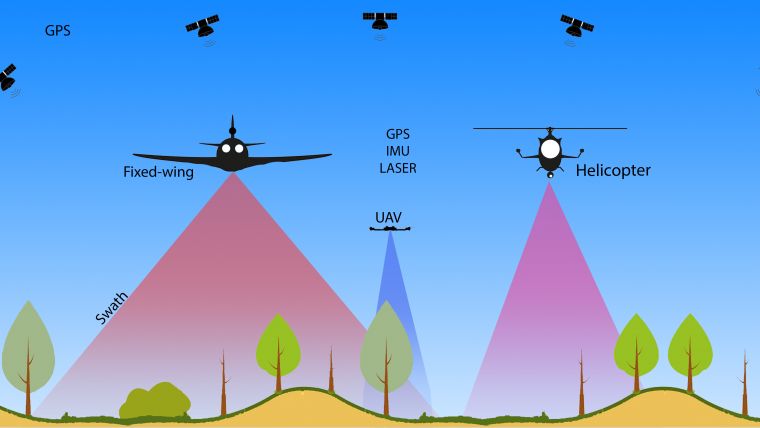
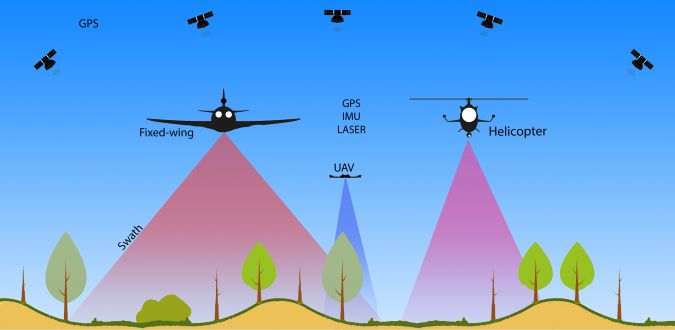
An airborne laser scanner (ALS) consists of various sensors. The laser ranger emits pulses to measure the distance from the sensor to where the pulse hits the surface of the Earth. To transfer the distances to X,Y,Z coordinates the pose of the sensor and its position have to be accurately measured using an inertial measurement unit (IMU) and a GNSS receiver onboard of the aircraft. Often also imaging sensors such RGB, hyperspectral, thermal or multispectral cameras are onboard. Helicopters are used as carrier for narrow swath measurements at low altitudes. They can hover thus providing point cloud densities up to 200 points/m2 with high accuracy (Figure 1). Fixed-wing systems are suited for high altitudes, covering large areas and capturing point clouds with lower densities. Satellite-based systems are a special category and relatively rare.
Benefits
Wide area systems provide accurate DEMs for orthorectification and contour generation suited for crop hazard analysis, hydrologic modelling and flood plain mapping. These systems also provide information on the heights of tree stands, biomass, excavation volumes, and support other natural resources management tasks. Furthermore, they enable mapping of transportation and utility corridors and in urban areas the 3D models derived from the point clouds enable line-of-sight studies, viewshed analysis, and many more. Helicopters and UAVs are well suited for capturing transmission lines for determining thermal rating and height of canopy. Furthermore, the point clouds acquired from these platforms are beneficial for monitoring railways, highways, levees and pipelines. In addition to capturing linear objects, these platforms are suited for collecting points of areas with a limited extent. The main benefits making ALS point clouds a very interesting source of spatial data are (Vosselman & Maas, 2010):
- Very high speed of data collection for large areas with each data point having information on 3D (X,Y,Z) position, intensity of the return and echo width in case of full-waveform digitisation
- High coverage allowing – at a later stage – to identify features which may have initially been missed in the field while accurate spatial data can be easily collected
- The elevation is measured directly by the sensor and not from image matching applied to the reflectance values of images which are highly sensitive to the types of object, humidity and other atmospheric conditions
- Multiple returns per pulse are used as an invaluable source of information in vegetated areas and thus in many forestry applications. Multiple returns can also provide insight into the vertical structure and complexity of forests.
Added to this, compared to images, ALS systems can see through canopy as the pulses can penetrate small gaps in vegetation and other semi-transparent objects and thus can provide additional information on physical properties of the object.
OBIA
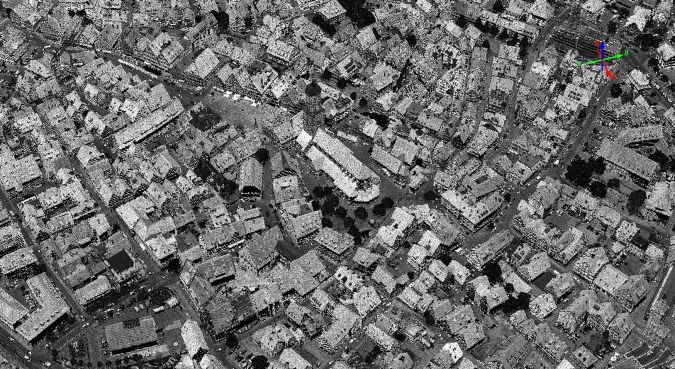
ALS collects a raw point cloud consisting of irregularly distributed 3D points. These points are geometric features but do not have a meaning per se since a point cloud does not represent structures of separable and clearly delineated objects—it is a group of points fixed in an internal or real-world coordinate system. The human eye can see patterns in such representations (Figure 2) but computers need processing to assign classes and provide meaning to groups of adjacent points. The classification of images involves assigning thematic classes to pixels. All pixels are of same size and same shape, and neighbouring pixels don’t know whether they belong to the same object. Object-based image analysis (OBIA) segments an image by grouping pixels based on similarities in spectral or other properties. The basic assumption is that a segment forms an object or a part of an object. However, ‘over-segmentation’ is sometimes required to classify complex objects such as a rooftop consisting of plain chimneys and dormers.
Context is Key
When looking at Figure 2 one may recognise buildings. In his 1982 pioneering book Vision, David Marr challenged scientists: “What does it mean to see? The plain man’s answer (and Aristotle’s, too) would be, to know what is where by looking. In other words, vision is the process of discovering from images what is present in the world, and where it is.” Similarly, OBIA aims to let computers ‘see’ beyond the plain pixels – what does this data represent within the real world? Context is the key. Advances in remote sensing technology in combination with higher spatial resolutions allow for more ‘intelligent’ image analysis including OBIA. According to Lang (2008, p.6) ‘intelligence’ includes in this context: (1) an advanced way of supervised delineation and categorisation of spatial units, (2) the way in which implicit knowledge or experience is integrated, and (3) the degree, in which the results contribute to an increase of knowledge and better understanding of complex scenes. So far, OBIA within geosciences has been used to partition satellite images into meaningful image-objects, and assessing their characteristics through spatial, spectral and temporal scale. Compared to pixels which have no direct counterpart in the real world these image-objects are more closely related to real-world objects. What we hopefully achieve are semantically interpretable segments. Such segmented imagery can be further processed by adding values to these objects or object candidates.
OBIA on Point Clouds
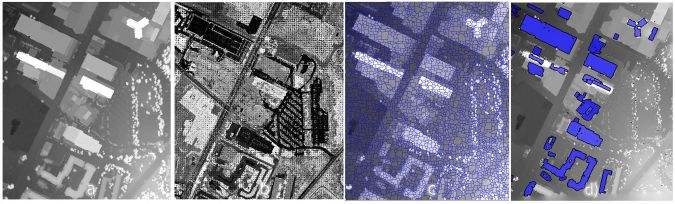
Recently, researchers started to apply OBIA to point clouds. To be suited for OBIA, point clouds usually have to be converted from a 3D representation to a 2D representation in the form of a raster, or 2.5D, that is a raster with one height value added to each grid cell. Such representations are suitable for further analysis (Figure 3). The segments which are homogeneous in height and or intensity of the return are used as input for grouping and classification. ALS point clouds do not contain RGB values. The raw data consisting of height, number of single beam reflections and intensity of the return can be enriched with information stemming from other sources. OBIA exploits size, shape, position and relationships to other segments which improves the classification results. For example, segments with straight outlines indicate buildings or streets, while fuzzy and irregular outlines may indicate vegetation. Therefore, OBIA enables an hierarchical multiple spatial scale approach, allowing to use characteristic nested scales of features for man-made or natural objects.
Example
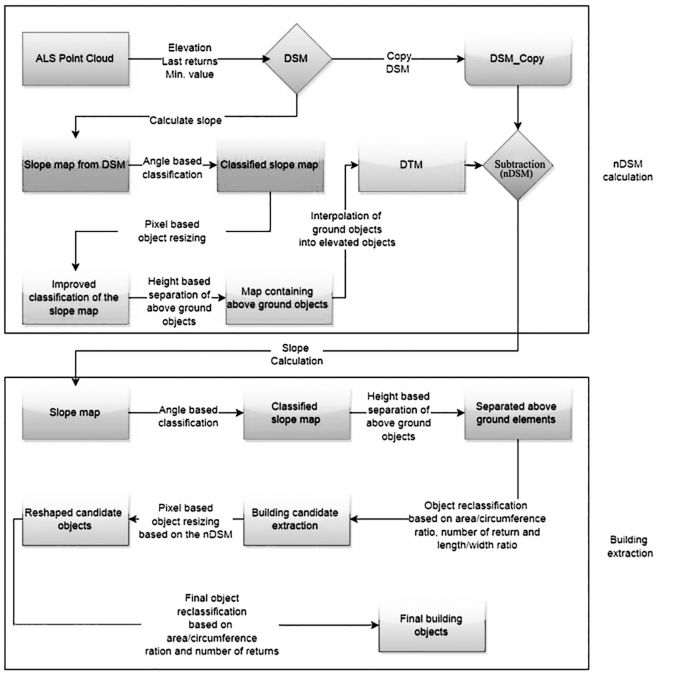
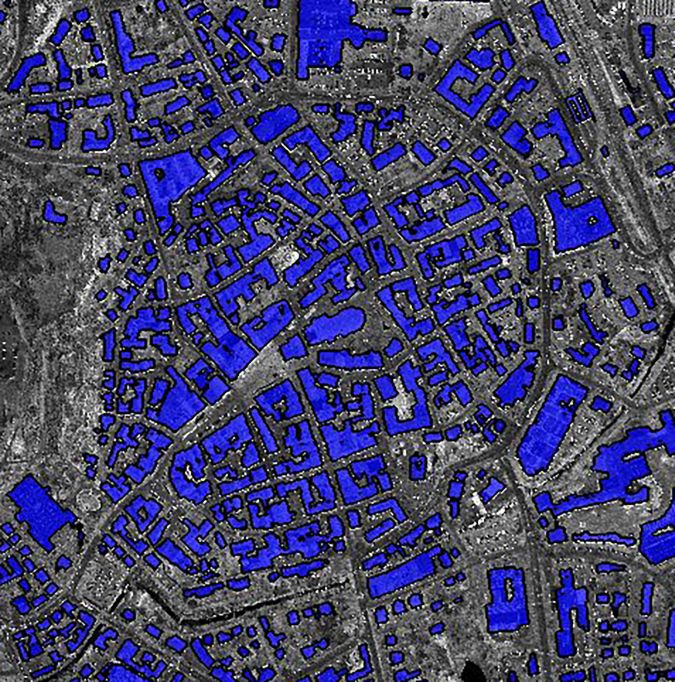
We developed an OBIA approach for automatically detecting and outlining buildings using the Cognition Network Language (CNL), a modular programming language within eCognition. The approach, of which an overall flow diagram is shown in Figure 4, was tested on an ALS point cloud partly covering the historical city centre of Biberach and der Riß, Germany, provided by Trimble and collected on March 2012 using a Trimble Harrier 68i system. The point cloud covers an area of 2.5km2, consists of multiple returns with intensity values and has an average point density of 4.8 point/m2. The old town is characterised by older, tightly compacted houses, some with sharing walls. The accurate result of the OBIA building extraction approach is shown in Figure 5.
Concluding Remarks
OBIA does not only provide good results for classifying images but is also highly suited for automated building extraction from ALS point clouds in the form of 2D polygons representing roof outlines.

Value staying current with geomatics?
Stay on the map with our expertly curated newsletters.
We provide educational insights, industry updates, and inspiring stories to help you learn, grow, and reach your full potential in your field. Don't miss out - subscribe today and ensure you're always informed, educated, and inspired.
Choose your newsletter(s)


