Oblique Airborne Photogrammetry (2)
Automatic Building Detection and Verification
Multiple view oblique imagery of very high resolution is a rich source of semantic information about buildings and other objects on the Earth’s surface. The efficient extraction of semantic information from such imagery requires automatic scene analysis for which new methods have to be developed. Here, the authors present new methods for automatic building detection and verification from oblique imagery.
(By Markus Gerke, The Netherlands, Jing Xiao, China and Adam Patrick Nyaruhuma, Tanzania)
The popularity of systematic collection of oblique airborne images will increase rapidly as it becomes easier for humans to recognise lateral parts of buildings and other elevated objects. When covered from different angles, a quasi-3D impression can be obtained. In research, automatic building detection and verification is mostly approached using Lidar point clouds, digital surface models (DSMs) or vertical airborne images. All these data sources have their own advantages and disadvantages. The use of height data helps to identify buildings and other objects which extend above the ground. However, confusion between objects is still possible, and good ground representation remains essential. Aerial vertical images are cheaper than Lidar data and are in many areas the only data source available. However, if only a 2D representation is available, the risk is that building roofs will remain undetected or will be interpreted wrongly. Overlapping oblique images enable height information to be derived through image matching, and this would ease the task. Oblique airborne images allow views of facades from multiple angles to be exploited and, compared to vertical images, such multiple views improve object identification. In addition, the point clouds created from dense image matching can be used.
Building Detection
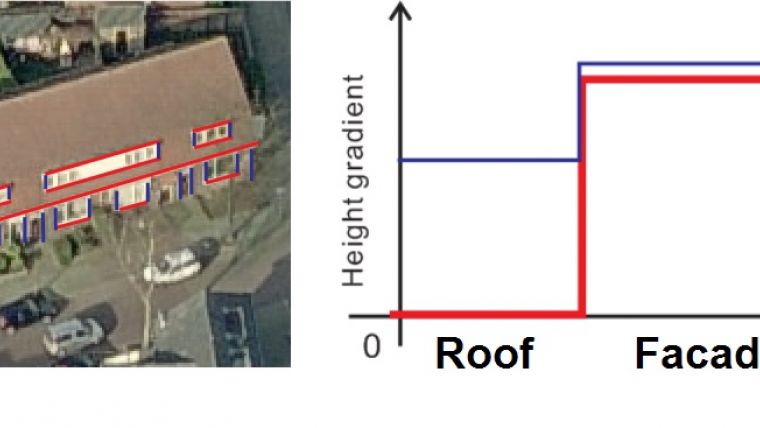
Currently, facade information for building detection is exploited by using points or lines. If the points on facades obtained from dense image matching are projected onto the horizontal plane, they accumulate in a building outline. The point cloud can also be used to compute height gradients: assuming that buildings have vertical walls, the gradient must show up accordingly. One may also look for horizontal and vertical line features in the images as they give strong evidence of the presence of buildings (Figure 1). The use of a combination of points and lines leads to results which are largely correct because the redundancy allows the efficient removal of wrong detections. However, the detection of all relevant buildings is not warranted as completeness depends on the scene characteristics and image configuration. Particularly, facades may be occluded through vegetation and high-rise buildings, which impedes proper detection.
2D Building Map Verification
When the presence of buildings in a map needs to be verified, for instance as a pre-processing step for map updating, the facades depicted in the oblique airborne images may be used directly as evidence of whether a building is still there or not. The method expands the 2D map information by exploiting height information, obtained from point clouds created by dense image matching of overlapping oblique images or other sources. The height information enables vertical plane patches to be defined which are assumed to represent walls. Straight lines and other features extracted from different oblique views can be projected onto these patches. Those features will coincide in the planar patch if the building is still there and mapped correctly (Figure 2). This approach works best if at least two oblique images depicting the facade are available. Our experiments show that the reliability is quite high, with 90% correct decisions.
Scene Analysis
Many applications require not only the detection of buildings but also of roads, trees, natural grounds and other objects. In remote sensing these are detected through supervised or unsupervised classification in which each pixel or cluster of adjacent pixels receives a semantic label based on spectral characteristics, texture or other features. In order to exploit the full information content of oblique images, such a procedure should be done per individual image. This is because images of the same scene taken from different viewing directions cannot be jointly analysed due to the significant relief displacement of elevated objects. An alternative is to assign semantic labels to voxels (volume elements: these are cubes, i.e. the extension of a raster into the third dimension). Similar classification techniques as for raster images can be conducted using colour or texture image features as well as features derived from the point cloud, such as normal direction of planar segments or height above the ground (Figure 3). The final result will be determined by not only the image resolution and overlap but also by the object definition, which is actually a key issue. For example, the definition of a facade as a vertical plane may be easily violated when balconies, bay windows and other building elements result in complex 3D structures rather than a plane. These elements have to be explicitly modelled, otherwise the analysis may produce incorrect results.
Concluding Remarks
To analyse oblique images, traditional terrestrial approaches – related to facade interpretation, for instance – need to be combined with geometric and topologic relations between the objects in the scene. Such advanced context modelling of large scenes should take into account the function and meaning of relations between facades and buildings on the one hand, and between buildings, roads, road furniture, etc. on the other.
Further reading
Gerke, M. and Xiao, J. (2013) Supervised and unsupervised MRF-based 3D scene classification in multiple view airborne oblique images, ISPRS Ann. Photogramm. Remote Sens. Spatial Inf. Sci., II-3/W3, 25-30, doi:10.5194/isprsannals-II-3-W3-25-2013, 2013.
Nex, F., Rupnik, E. and Remondino, F. (2013) Building Footprints Extraction from Oblique Imagery, ISPRS Ann. Photogramm. Remote Sens. Spatial Inf. Sci., II-3/W3, 61-66, doi:10.5194/isprsannals-II-3-W3-61-2013, 2013.
Nyaruhuma, A.P., Gerke, M., Vosselman, G. and Mtalo, E.G. (2012) Verification of 2D building outlines using oblique airborne images. In: ISPRS Journal of Photogrammetry and Remote Sensing, 71 (2012) pp. 62-75.
Xiao, J., Gerke, M. and Vosselman, G. (2012) Building extraction from oblique airborne imagery based on robust facade detection. In: ISPRS Journal of Photogrammetry and Remote Sensing, 68 (2012) pp. 56-68
Biographies of the Authors
Markus Gerke received an MSc degree in geodetic sciences and a PhD degree, both from the
Leibniz University of Hannover, Germany, in 2000 and 2006 respectively. He has been assistant professor at the Faculty ITC, University of Twente, Enschede, The Netherlands, since 2007. He focuses on capturing geometric and semantic information from images with the emphasis on automatic processing and interpretation of oblique airborne and UAS images. He is co-chair of the ISPRS working group III/4 and co-organiser of the ISPRS benchmark test on urban object detection and reconstruction. As of January 2017 Gerke is chairing the Institute of Geodesy and Photogrammetry of the Technical University of Braunschweig, Germany.
Jing Xiao received her PhD degree from University of Twente, The Netherlands, in 2013 and is now a post-doc at the School of Computer Science, Wuhan University, China. Her research interest lies in object extraction from image and video data, 3D reconstruction and data compression.
Adam Patrick Nyaruhuma attained an MSc in geoinformatics from ITC in 2007 and a PhD from the University of Twente, Enschede, The Netherlands, in 2013. His research focuses on oblique aerial photography for verification of urban geodatabases. He currently works for the Ministry of Lands, Housing and Human Settlements Development, Tanzania’s National Mapping Organisation.
Figure captions
Figure 1, Automatically detected horizontal and vertical lines(left) and a sketch of the height gradients computed from the dense point cloud.
Figure 2, Detected straight lines indicated in blue (top); some of them will intersect with the plane through the map building outline, others will not (bottom).
Figure 3, Grey-coded dense point cloud (left) and colour-coded (middle) and the result of automatic classification in five classes using voxels.

Value staying current with geomatics?
Stay on the map with our expertly curated newsletters.
We provide educational insights, industry updates, and inspiring stories to help you learn, grow, and reach your full potential in your field. Don't miss out - subscribe today and ensure you're always informed, educated, and inspired.
Choose your newsletter(s)


