On-the-fly decision support in flood management
Combining methods for fast simulation and 3D visualization
This integrated flood simulation and visualization system provides answers on the fly and presents 3D visualizations that even non-experts can understand.
In flood and storm water management, simulation is widely used for flood risk assessment, for designing mitigation measures and for sustainable urban planning. In this context, live sessions are an effective tool for collaboration between domain experts and decision-makers to discuss and develop new ideas. This article presents an integrated flood simulation and visualization system that is able to provide answers to the questions of experts and stakeholders on the fly. It supports fast incorporation of new parameters through visual interfaces, immediate provision of simulation results, derivation and analysis of key indicators, and 3D visualizations that even non-experts can understand.
In the standard workflow of flood and storm water management, flood simulation is separated from the analysis and visualization of the results. Moreover, these steps usually happen offline, prior to the presentation of the results to decision-makers and stakeholders. If new ideas or questions emerge during the presentation (e.g. about possible protection measures), the entire time-consuming process has to be repeated, which might take days.
The interactive decision support system called Visdom drastically shortens this process by combining simulation, analysis and visualization in a single tool. Working with alternative scenarios is a core concept in this system. Users can vary simulation parameters over different scenarios and compare the simulated outcomes right away to analyse the consequences of individual parameter variations. The simulation parameters include properties of flooding events such as the intensity and duration of rainfall, the magnitude of river floods or the failure of existing protection measures. They also include characteristics of hypothetical protection measures such as mobile barriers (short-term measures) or retention areas (long-term measures).
Thanks to the integrated design, Visdom provides immediate answers to questions about flood incidents and mitigation measures that might emerge during live sessions with domain experts, stakeholders and decision-makers. Ideally, these answers prompt new ideas to refine simulation parameters, e.g. by adding a new barrier. In Visdom, initial results are available after just a few seconds. The interactivity of the system has been demonstrated in live sessions, such as at the Cologne Flood Protection Center in Germany. Decision-makers in Cologne currently use the system remotely, which is made possible by the client-server architecture.
Fast simulation
To cover a wide range of possible flood disasters, various types of flooding scenarios are considered, such as river flooding, heavy rainfall or sewer overflows. Water propagation is calculated by solving the 2D shallow-water equations. The simulation uses an improved numerical scheme avoiding unrealistically high velocities at dry/wet boundaries. The implementation is optimized for the parallel processing architecture of modern graphics processing units (GPUs), making computation many times faster than real time. For sewer or subway networks, a 1D pressurized-flow simulation is used. This can be coupled with the surface flow simulation at sewer inlets, for example.

On-the-fly analysis and 3D visualization
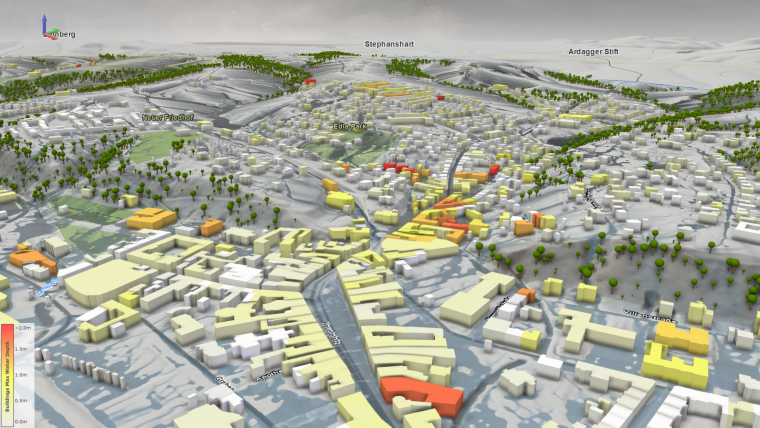
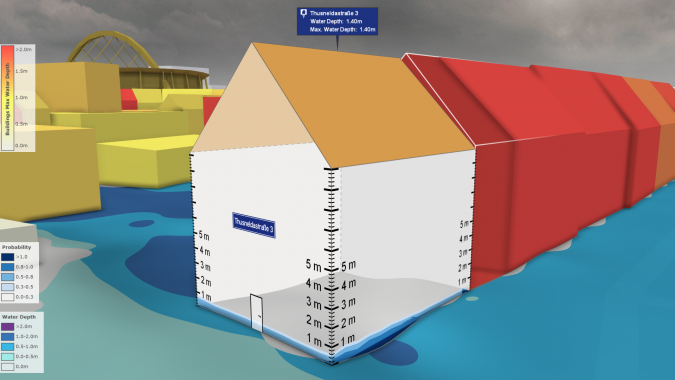
Depending on the extent of the simulation domain, the dataset can be very large and contain the results of numerous scenarios. For prompt visual feedback, analysis tasks are executed in parallel. One such task is the estimation of building damage from inundation (visualized in colour in Figure 1). For damage estimation, multiple scenarios can be considered simultaneously, e.g. to determine the average or worst-case outcomes. In this context, it also makes sense to visualize the uncertainty of the predicted outcomes. In Figure 2, simulated water levels are visualized together with their probabilities along the façade of a user-selected building. For this, once the user has selected the building, the system extracts flooding probabilities for that building from all simulated scenarios on the fly. In Figure 2, the terrain is colour-coded according to the maximum water depth.
For effective public communication, visualizations of simulation results should be intuitive. Besides the abstract terrain colouring, a realistic water surface representation is used (Figure 1). Most people have an intuitive understanding of how water looks, so a natural depiction of water increases the interpretability of the visualizations. For the efficient rendering of water in real time, established rendering techniques from the entertainment industry have been adopted and combined with specially tailored algorithms. Various effects provide subtle hints, such as animated waves and foam to indicate flow directions and velocities.
Simple setup of new scenarios
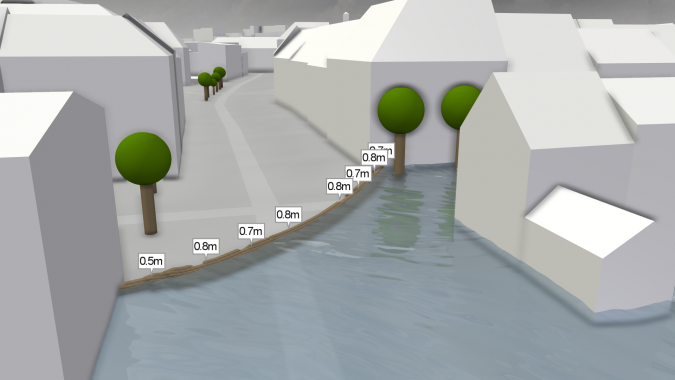
To test new ideas on the fly during live sessions, it should be easy to create and modify scenarios. Visdom offers sketch-based interaction so that users can intuitively perform common tasks by directly interacting with the 3D visualization. No expert knowledge is required to change simulation parameters. For example, user interface elements for the display and manipulation of values are embedded in the 3D view. Simulation domain boundaries can be dragged in the 3D view and protection measures are sketched directly on the terrain (Figure 3). These interactions make it possible to modify an existing scenario within seconds to examine the consequences.
Design of urban protection measures
Cologne is currently protected by more than 11km of protection walls along the River Rhine. The Flood Protection Center is responsible for the city’s preparedness for and response to flood-related incidents such as overtopping of protection walls, breaches or heavy rainfall. Designing flood protection measures in complex urban environments is a challenging task. Here, Visdom assists decision-makers with interactive scenario-based modelling. After specifying the flood incident (e.g. by inputting a water level in the river or by picking a breach location), users are able to quickly test and compare the effectiveness of different mitigation measures. For example, using the mouse, a mobile water barrier for the protection of important infrastructure can be sketched on the terrain. When simulating the scenario, the system automatically adjusts the barrier height locally to the water depth (Figure 3). Material requirements are computed as well as the delivery routes and times for the pre-defined depot locations. By modelling and comparing a multitude of different scenarios on the fly, flood managers are able to prepare a pool of response plans for the relevant incidents.
Heavy rain modelling
In recent years, storm water management has become a hot topic for communities of all sizes, from small villages to large cities. In case of heavy rainfall, not all water seeps away; much of it runs off and collects in surface depressions, causing damage to infrastructure, property and, sometimes, people. The pressurized flow in sewer pipes can cause unexpected overflows in multiple locations. Potential pipe clogging caused by debris further complicates the situation. In short, storm water events are complex phenomena involving water exchange between the surface and the sewer network.
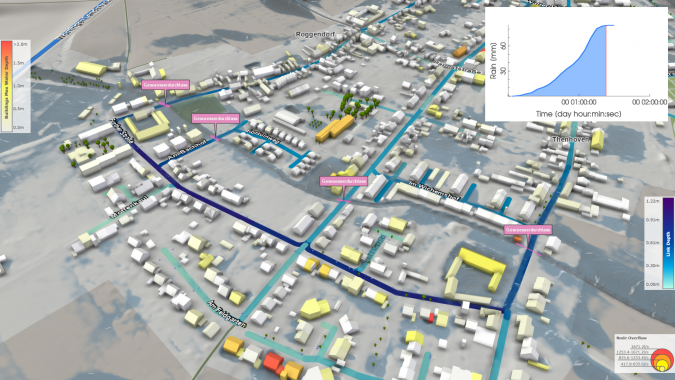
In Visdom, the models for the surface flow and the underground flow in sewer pipes are tightly interlinked and treated coherently. The water consumed by sewer inlets is removed from the surface and vice versa, thus preserving the total amount of water. The system allows the user to model storm water scenarios of varying intensity, e.g. for risk assessment, for the creation of mitigation plans or for designing a sewer network. Using simple interactions, it is possible to simulate pipe clogging or to sketch additional sewer inlets. Visdom is currently used to assess risks caused by storm water events in several communities in Austria and Germany (Figure 4).
Detailed flood risk analysis on a national scale
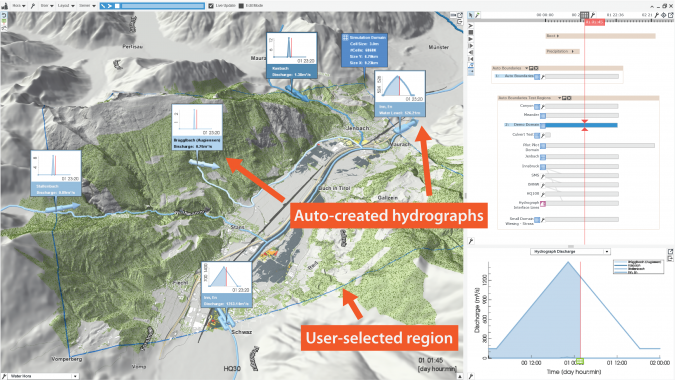
Simulation-based flood risk assessment on a national scale poses challenges with respect to the heterogeneity and the sheer size of the data. The HORA 3 project, commissioned by the Austrian Ministry of Sustainability and Tourism together with the Austrian Insurance Association, focuses on flood modelling for all rivers and streams in Austria. In this project, Visdom is the main software platform, combining methods from rainfall-runoff modelling, hydrodynamic simulation, geospatial analytics and visualization. The user can pick a region of interest anywhere in the country and specify the annual flood probability (e.g. once in ten years, once in 100 years). Behind the scenes, the system automatically derives all necessary boundary conditions and other parameters for the simulator (Figure 5). Therefore, flood simulation can be triggered instantly, without a complex and error-prone setup process. The goal of the project is to create detailed flood risk maps for different flood probabilities and make them publicly available through the project website. Using these maps, citizens will be able to estimate the vulnerability of their premises to possible future flood hazards.
Further reading
- Horváth, R. A. P. Perdigão, J. Waser, D. Cornel, A. Konev, G. Blöschl (2016) Kepler Shuffle for Real-World Flood Simulations on GPUs, International Journal of High Performance Computing, 30(4).
- Cornel, A. Konev, B. Sadransky, Z. Horváth, E. Gröller, J. Waser (2015) Visualization of Object-Centered Vulnerability to Possible Flood Hazards, Computer Graphics Forum, 34(3).
More information
http://visdom.at/media/videos/mp4/flood_and_stormwater_modelling_2018.mp4
Acknowledgements
VRVis is funded by BMVIT, BMDW, Styria, SFG, and Vienna Business Agency in the scope of COMET – Competence Centers for Excellent Technologies (854174), which is managed by FFG.

Value staying current with geomatics?
Stay on the map with our expertly curated newsletters.
We provide educational insights, industry updates, and inspiring stories to help you learn, grow, and reach your full potential in your field. Don't miss out - subscribe today and ensure you're always informed, educated, and inspired.
Choose your newsletter(s)


