Operation IceBridge
Largest-ever Airborne Survey of Earth's Polar Regions
Operation IceBridge completed its 2014 Antarctic field campaign, the sixth in a row, at the end of November. The campaign was aimed at recapturing a part of the Antarctic ice sheet which appears to be in irreversible decline. For six weeks from 16 October 2014, NASA’s DC-8 airborne laboratory collected a wealth of data for the benefit of gaining insight into climate change. The first IceBridge flights were conducted in spring 2009 over Greenland and in autumn 2009 over Antarctica. What is Operation IceBridge, which sensors are used, what can the data be used for and who may use the data? The author provides an overview.
Long-term changes in the extent and thickness of glaciers, ice sheets and snow covers are indicators of temperature changes and thus climate change. Snow reflects 80-90% of the incoming solar energy, while soil, vegetation or rock absorbs 80-90%. Absorption results in a warming of the Earth’s surface causing yet more snow to melt – a typical feedback loop. Study of the places where water often alternates between a solid and liquid state provides insight into the changes in the extent and thickness of ice and snow and thus in temperature changes. When ice sheets and glaciers plunge into the sea, the water level rises; however, their subsequent melting does not affect the sea level. Glaciers, which cover 10% of the land and store 75% of the world's fresh water, change the morphology of the landscape when they plough through bedrock. Continuous study of these phenomena and their changes over time requires collection of data over many years on snow depth, ice surface elevation, ice thickness and the shape and composition of rock beneath the ice.
From ICESat to IceBridge
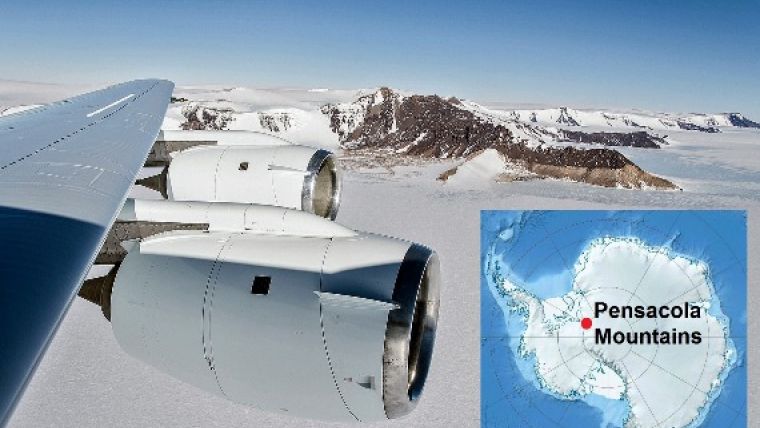
To collect such data in the Arctic and Antarctic regions NASA launched the Ice, Cloud and Land Elevation Satellite (ICESat) in 2003. It stopped collecting data by the end of 2009, and ICESat-2 is scheduled for launch in 2017. The time gap in data collection between ICESat and ICESat-2 will be bridged by airborne surveys: IceBridge. Flights with the DC-8 laboratory (Figure 1) began in October 2009, later joined by a P-3 Orion, a King Air B-200, in 2010, the Gulfstream V in 2011 and the Guardian Falcon in 2012. The campaigns are carried out when the ice surface is stable. For the Arctic region this is from March to May and for the Antarctic region from October to November (Figure 2). The daily flights each last 8 to 12 hours in which two to three terabytes of data are captured. Compared to a satellite, an aircraft can observe an area of far less extent (Figure 3) and can only collect data for a few weeks. Conversely, the benefit of using aircraft is that they can carry a suite of dedicated sensors.
Sensors
The suite of sensors installed on the DC-8 laboratory and other aircraft during campaigns includes:
- Digital mapping system (DMS)
- Airborne topographic mapper (ATM)
- Land, vegetation and ice sensor (LVIS)
- Gravimeter
- Magnetometer
- Four radar sensors.
The four radar sensors will be treated in the next section. The DMS is a nadir-looking camera recording digital images which are stitched into mosaics and used for detecting openings in sea ice and to create detailed maps. The ATM is a scanning Lidar that measures the surface elevation. Changes in elevation of the ice surface over the years and thus volume changes can be determined from a time series. The LVIS is an additional Lidar sensor optimised for operation at high altitudes, thus enabling the survey of large areas. The gravimeter senses the density of the materials under the ice surface. Water has less density than rock and thus has a lower gravitational pull, enabling rock to be distinguished from water and the shape of water cavities under floating ice shelves to be determined. Accelerometers measure the force of gravity while gyroscopes keep the pose of the sensor stable. GNSS measurements enable removal of the accelerations caused by the motion of the aircraft. Density combined with magnetometer data gives indications about the type of bedrock material. Shape and composition of bedrock helps to predict how moving ice interacts with bedrock and how warm sea water might flow beneath the ice.
Radar
Radar allows sub-surface mapping from high altitudes. IceBridge uses four radar sensors integrated in one package: (1) ku-Band radar altimeter; (2) snow radar; (3) accumulation radar; and (4) multichannel coherent radar depth sounder (MCoRDS). The sensors operate in the microwave part of the electro-magnetic (EM) spectrum. The high frequencies can see more detail but the depth of penetration is limited, whereas low frequencies can penetrate several kilometres into snow and ice. The frequency bands of the four radars differ. Combined they enable the entire snow/ice sheet to be examined, from the surface to the bedrock or sea surface. The ku-band radar is a wideband altimeter that operates over the frequency range from 13-17GHz (wavelength ~ 2cm), which is similar to the primary sensor on the CryoSat-2 operated by the European Space Agency (ESA). The ku-band penetrates through snow and reflects off the surfaces of ice sheets and the sea. Combining this with ATM data enables the thickness of snow over sea ice to be determined. The snow radar uses the frequency range from 2-8GHz (wavelength range: 4-15cm) to map the characteristics of snow on top of ice sheets with high vertical resolution, thus allowing detection of the snow and ice surfaces and the layers in between. Its data is used to measure recent snow accumulation rates and to calculate sea-ice thickness. The frequencies of the accumulation radar range from 600-900MHz (wavelength range: 33-50cm) which may penetrate snow and ice to a depth of 100m. It shows the layers with strong and continuous reflection, thus providing insight into snow accumulation rates in the past or over longer time spans. Figure 4 shows an example of a profile generated from such radar data. The data from the accumulation radar, snow radar and ku-band radar combined enable a study of the top 100 metres, but it is not possible to build a decent ice-sheet model without good elevation data representing the bed topography. For this purpose a fourth radar has been developed: the MCoRDS, which employs many frequencies to image internal ice layering and bedrock. MCoRDS data enables improvements to computer models aimed at forecasting how ice sheets will respond to climate change.
Jacobshavn
The sensors discussed above, enable removal of snow and ice in virtual landscape models created by a computer, thus uncovering bedrock. Removing ice and snow from the land area of Greenland revealed a canyon, the longest on Earth, under the ice sheet: the Jacobshavn bed (Figure 5). Extending over 750km and with a depth of 800m and a width of 10km, the ravine matches the Grand Canyon in scale. Its discovery in August 2013 will bring better insight into how water, snow and ice move over the island. It may explain why Greenland is not filled with buried lakes, which one would expect given the bowl-shaped basin in the interior caused by the weight of the ice sheet. Water melting under the interior ice sheet seems to drain into the sea through the northern part of the canyon instead of pooling in the middle. The distinctive V shape and the flat bottom suggests that the canyon was carved by water, rather than ice, but that still does not sufficiently explain the absence of buried lakes. Maybe other canyons, as yet undiscovered, also contribute to water draining into the sea.
Open Data
The masses of data have to be processed within six months to enable timely publication on the NSIDC website. The first of the many processing steps is archiving and quality control. Next, four data categories are produced from raw data for over 60 data products. These end products result from processing data from single sensors, combining data from several sensors or from applying computer models. The ATM data, for example, is available in a raw format as distance between the aircraft and the ice sheet. Such raw range data enables users themselves to calculate ice surface elevation, ice slope and roughness, and elevation changes over time. The data can be accessed at the NSIDC website through an interactive map from which individual flight lines and datasets can be selected for downloading. The products stick to the standards of NASA’s 2006 Earth Science Reference Handbook, which eases understanding and use. Its free availability allows anyone to explore the data. Scientists around the world are building maps of the bedrocks of Greenland and Antarctica, and improving seasonal forecasts of Arctic sea-ice coverage and glacial melt rates.
Concluding Remarks
Unmanned aerial systems (UASs) may enable creation of even more detailed maps of the bedrock. The finer the resolution, the better – and since UASs enable dense flight lines to be followed, they would be well-suited. IceBridge's upcoming Arctic campaign is scheduled to begin in March 2015.
Acknowledgements
Thanks are due to George Hale, Science Outreach Coordinator of Operation IceBridge, NASA Goddard Space Flight Center, for providing information and commenting on the final draft.
THE AUTHOR
Mathias Lemmens gained a PhD degree from Delft University of Technology, The Netherlands, where he presently lectures on geodata acquisition technoogies and geodata quality. He was editor-in-chief of GIM International for ten years and now contributes as senior editor.

Value staying current with geomatics?
Stay on the map with our expertly curated newsletters.
We provide educational insights, industry updates, and inspiring stories to help you learn, grow, and reach your full potential in your field. Don't miss out - subscribe today and ensure you're always informed, educated, and inspired.
Choose your newsletter(s)


