Public Participation Using 3D City Models
E-participation Opportunities in Kenya
The importance of involving the general public in the design of urban plans and development scenarios is widely recognised. Today’s web technology and availability of 3D city models at various levels of detail enable local governments to communicate spatial plans effectively to their citizens. They also enable citizens to comment on and propose alternatives, thus providing feedback to local authorities. This means public participation is enhanced through e-participation. Read on for details of the opportunities offered by e-participation in Kenya.
Implementation of an urban development plan affects the lives of citizens residing or working in or near the area covered by the plan. The widening of an existing road will increase mobility but decrease liveability for the residents in the vicinity of that road. It is broadly recognised that citizens should have a voice in the planning of urban developments. The importance of citizens having a voice in plans which invoke environmental issues was recognised by the United Nations over 25 years ago and anchored in Principle 10 of the Rio Declaration of 1992 (see below).
E-participation
Web technology, 3D city models and 3D visualisation software can help in enhancing citizen feedback on spatial plans produced by authorities. Web technology eliminates the need for citizens to gather together at a certain place, at a particular moment; instead, individuals can choose how, when and where to participate, even anonymously if preferred. Furthermore, 3D visualisation of 3D city models stimulates the exchange of alternatives among stakeholders. In the developed world e-participation is increasingly being exploited to involve citizens in urban planning and management, but its use is still modest in developing countries. To demonstrate the feasibility of e-participation in developing countries, the authors created a 3D city model of Kisumu City, Kenya, which citizens can access via a web portal. Afterwards, experiments were conducted to measure the potential participation ability of six groups with different backgrounds, varying from the general public to professionals such as planners.
Creation of the 3D City Model
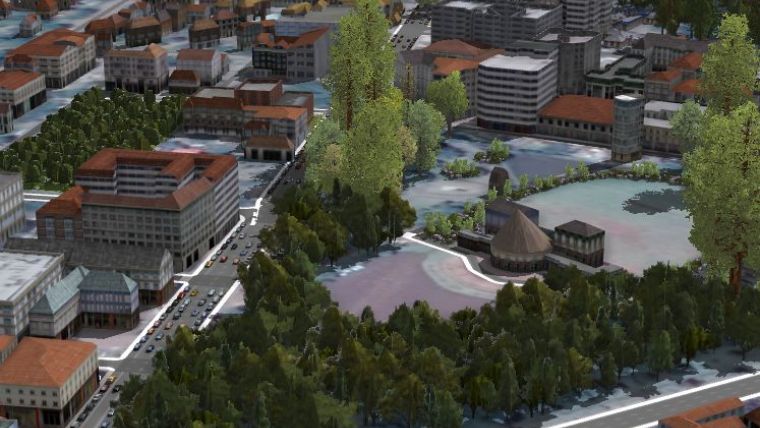
The fundamental data for creating the 3D city model consisted of a digital elevation model (DEM), a GeoEye image acquired in 2009 with a ground sampling distance (GSD) of 50cm, and data provided by the city government. The satellite image was draped over the DEM; the resulting geodataset acted as a foundation for creating the 3D city model. Shapefiles of the parcel boundaries, transport networks, administrative boundaries, building footprints and building heights – all data provided by the city government – were imported into CityEngine (2016) while keeping the geographical attributes from ArcGIS 10.4.1 intact. An LoD2 3D city model was generated by automatic texturing of LoD1 with image patches of building façades extracted from Google Earth. To give the final touch the model was manually edited (Figure 1). Next, the 3D model was visualised in a web portal provided by ArcGIS Online. This web-based 3D model was then used to test the suitability for e-participation. Participants could take part remotely, eliminating the need for town-hall meetings. Accounts enabled people to log in, view, navigate through and write comments. Opinions and alternatives were discussed during plenary workshops (Figure 2).
Participant Abilities
To test how participants would experience and cope with the designed 3D model, two tasks were created: one related to 2D maps and the other to the 3D city model. In the 2D task participants received a 2D map on an A3-sized sheet of paper showing plot numbers and road networks and a list with ten feature names. Each participant had to select the name of a feature from the list, locate it and mark it on the 2D map within a time span of 10 minutes. In the second task participants carried out a similar task but now exploiting the 3D city model in a web-based geoportal instead. Their performance was measured in terms of the time needed to complete the tasks (efficiency), the number of correctly identified objects (effectiveness) and the participants’ reflections on their experiences (satisfaction). The 37 participants were categorised in six groups (Table 1).
|
Group |
Males |
Females |
Total |
Average age |
|
Students |
8 |
10 |
18 |
22 |
|
Planners |
4 |
1 |
5 |
50 |
|
Surveyors |
4 |
1 |
5 |
49 |
|
Architects |
1 |
2 |
3 |
34 |
|
Engineers |
2 |
0 |
2 |
33 |
|
Others |
3 |
1 |
4 |
41 |
|
Total |
22 |
15 |
37 |
36 |
Table 1, Characteristics of the various groups of participants.
Results
Figure 2 shows a graph of the average time each of the six groups needed to complete the 2D task (blue bars) and the 3D task (orange bars). For all groups, the 3D task took less time than the 2D task. Experience plays a role: planners needed less time on average while students needed most time for both tasks. The 3D task resulted in more correct answers than the 2D task, but none of the groups managed to provide all the correct answers within the given time (Figure 3). With 53% correct answers, the students performed poorly in the 2D task, while engineers performed poorly in the 3D task. 83% of the participants preferred 3D over 2D.
Of course, the web portal can be improved and the participants’ abilities are affected by some imperfections in the interaction with the web-based geoportal. The participants were able to view and navigate through the different objects and place comments. As mobile phones have a high penetration rate throughout the entire population in developing countries, e-participation using various web technologies – including smartphones, online forums and emails – could become the preferred approach.
Concluding Remarks
Participation does not necessarily mean that the public becomes part of all major decisions. Therefore, planning agencies should first define the issues and questions for which citizens’ input is desired. Moreover, the participants’ level of influence should be clearly communicated. These factors will all help to stimulate public participation and to define the roadmap. Future research will focus on the development of a stand-alone 3D web portal with full e-participation facilities. The addition of interactive facilities makes it more flexible and easier to use, enabling information exchange and learning. How users experience an e-participation tool depends on its complexity, its design and its purpose. Hence, such a tool cannot be developed without an explicitly defined application context.
Principle 10
At the national level, each individual shall have appropriate access to information concerning the environment that is held by public authorities, including information on hazardous materials and activities in their communities, and the opportunity to participate in decision-making processes. States shall facilitate and encourage public awareness and participation by making information widely available. Effective access to judicial and administrative proceedings, including redress and remedy, shall be provided.
Acknowledgements
Thanks are due to the City Government of Kisumu, Kenya, for providing data, to Dr Moses Kola, dean of the School of Planning and Architecture, for supporting the fieldwork, and to staff and students at ITC and Maseno University.
Further Reading
Onyimbi, J.R, Koeva, M.N, Flacke, J. (2017) Assessing the impact of 3D visualization and e-participation on public participation in planning processes in Kisumu City, Kenya. (ITC)

Value staying current with geomatics?
Stay on the map with our expertly curated newsletters.
We provide educational insights, industry updates, and inspiring stories to help you learn, grow, and reach your full potential in your field. Don't miss out - subscribe today and ensure you're always informed, educated, and inspired.
Choose your newsletter(s)


