Reconstructing 3D buildings using deep learning
The future of city modelling from geospatial data
How can artificial intelligence and deep learning lead to a robust process for 3D city modelling? And what are some of the challenges?
Automated classification and object detection in Lidar and imagery data is essential for minimizing production costs. While the optimization of traditional methods using rule-based algorithms has enhanced geospatial applications, significant manual intervention is still required to obtain a high-quality dataset. This article outlines how artificial intelligence (AI) can lead to a robust process for 3D city modelling and discusses some of its challenges.
Artificial intelligence for remotely sensed data
With recent advances in the field of remote sensing, the use of AI has increased significantly among the geospatial community. Extracting meaningful information from an enormous amount of data, now being collected every day, is crucial and requires a workflow that is both efficient and accurate.
There are several articles and case studies in which deep learning (DL) methods are used for aerial Lidar classification and object detection; however, utilizing a DL method for industry-level and large-scale applications is a demanding task and incorporating it into the production workflow is a challenge.
Extracting information through the integration of Lidar and ortho is usually done using automatic methods that involve either colourizing Lidar points using images or concatenating RGB-NIR channels with extracted feature layers from Lidar, such as the digital terrain model (DTM) or the digital surface model (DSM). As a result of these fusions, either the 3D geometrical information of point clouds degrades when transformed into a 2D raster file, or the quality of point cloud colourization deteriorates due to reasons such as shadows, obstacles, edges, and so on.
Nevertheless, integrating Lidar and imageries provides an opportunity to improve the AI results for many applications.
Automatic 3D city modelling vs deep learning models
In automatic methods of 3D modelling that use a programmatic approach to extract the features and digitize the outlines manually, large-scale Lidar datasets must go through a multi-step routine to be classified.
An automatic classification routine would usually include classifying ground points, separating points above ground into classes, and grouping and classifying buildings based on their planar features and other attributes, such as echo. However, various components of the buildings may not be properly classified, such as edges, hips, chimney flashing and walls, depending on the texture complexity and Lidar point density. Adjacent objects to buildings such as trees might also be misclassified. This is why manually editing Lidar points is usually required to achieve high-quality data. As a result, the process of automatic Lidar data classification becomes ‘semi-automatic’ and labour-intensive.
Deep learning methods, on the other hand, can perform classification and object detection tasks much faster once trained. One of the main requirements of DL methods and their use in real-world scenarios is the necessity of high-quality training data and the ability to easily differentiate the existing classes in the data from each other. For example, traditional methods tend to eliminate the noisiness of the data by limiting ground points in small triangles. This would leave points with similar characteristics in two different classes, which would cause the DL model to not converge.
Training model and data preparation
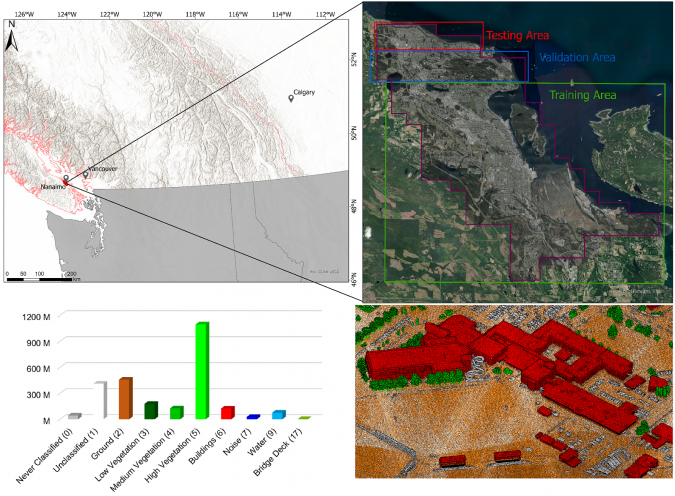
To train and test a DL method, we used 186km2 of aerial Lidar from Nanaimo, BC, Canada, with approximately 30,000 roof segments that were automatically classified using TerraSolid and manually digitized by human editors.
The dataset has an average point density of approximately 19pts/m2 and was originally classified into the classes: Never Classified (0), Unclassified (1), Ground (2), Low Vegetation (3), Medium Vegetation (4), High Vegetation (5), Building (6), Noise (7), Water (9) and Bridge Deck (17). Since the objective of this work was mainly 3D city modelling and because the buildings were the objects of interest, we reclassified the data into Never Classified (0) and Building (6), so that the DL model could better differentiate buildings from other points. We used 80% of the Nanaimo data as the training set and 13% for validation. The remaining 7% was used to test the model.
We used the PointCNN model for this purpose and the Lidar data was prepared and fed to the network in block sizes of 50 x 50m with 8,192 sample points per block. Intensity and return numbers were considered in the process as extra features. The coordinates of Lidar points were normalized in the range of the defined block size, and intensity values and return numbers were normalized between 0 and 1.
Table 1 shows the precision, recall and F1 scores obtained for the Never Classified and Building classes for our training dataset. It indicates that, despite having imbalanced data (with buildings being just under 5% of the total dataset), the model was able to properly differentiate buildings from other points.

Challenges in automation
One of the major limitations of deep learning models is that performance is considerably affected when they are tested on a new dataset or on a dataset with different characteristics, which frequently occurs because of different project specifications (e.g. density level) and varying geographic sites (e.g. urban, forested, mountainous). Therefore, to automate the classification procedure while obtaining acceptable results in various scenarios, it is necessary to make sure that the DL model is generalized and can predict datasets with different characteristics. The new dataset must however have similar feature attributes to the dataset with which the model was trained.
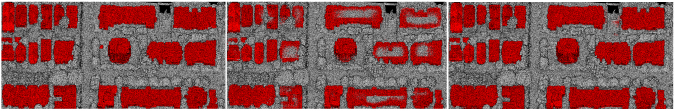
After training the model with the above Nanaimo dataset and achieving highly accurate results, we tested the model on a Vancouver dataset. The Vancouver dataset had an average point density of nearly 45pts/m2, which is noticeably higher than the Nanaimo dataset. As expected, the primary prediction results did not have the same accuracy as the Nanaimo dataset and the model failed to correctly classify a significant portion of the building points (as represented by a recall value of 67.43% for buildings in Table 2).
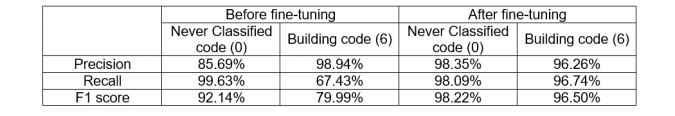
To improve the performance of the model on the Vancouver dataset, a small amount of the Vancouver dataset (ten 1km x 1km tiles in total) was used to fine-tune the pre-trained model. As can be seen in Table 2, the performance of the model significantly increased and building points were classified with an F1 score value of 96.50%.
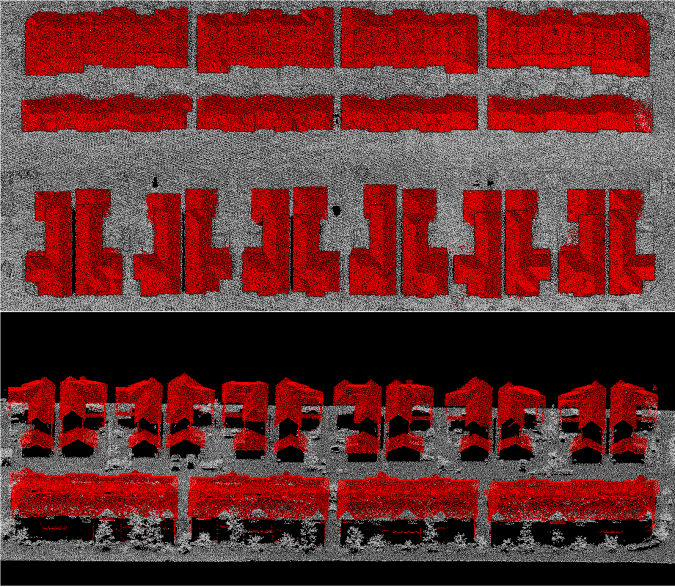
After fine-tuning the model with the Vancouver dataset, it was tested on a new dataset from the City of Calgary. The Lidar data for Calgary had an average point density of approximately 38pts/m2. As can be seen in Figure 3, the buildings in the Calgary dataset were classified with a high accuracy and the model was able to distinguish buildings from adjacent objects such as bushes, trees and cars.
Refining building classification with images
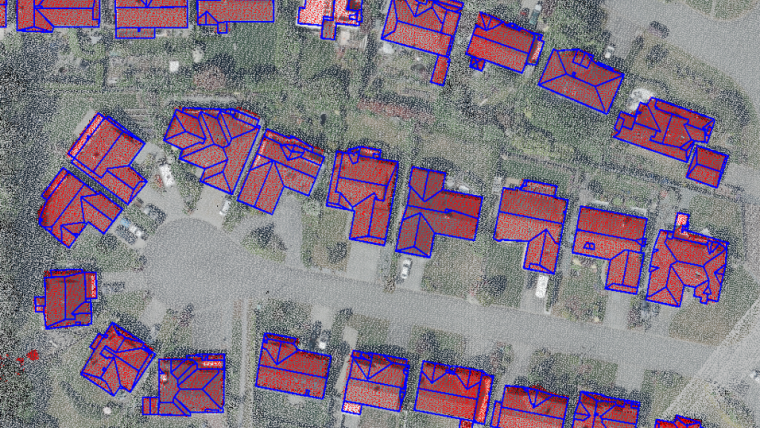
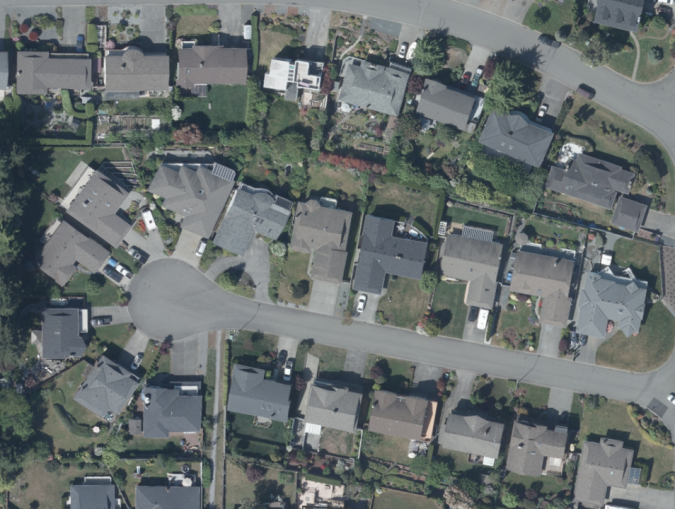
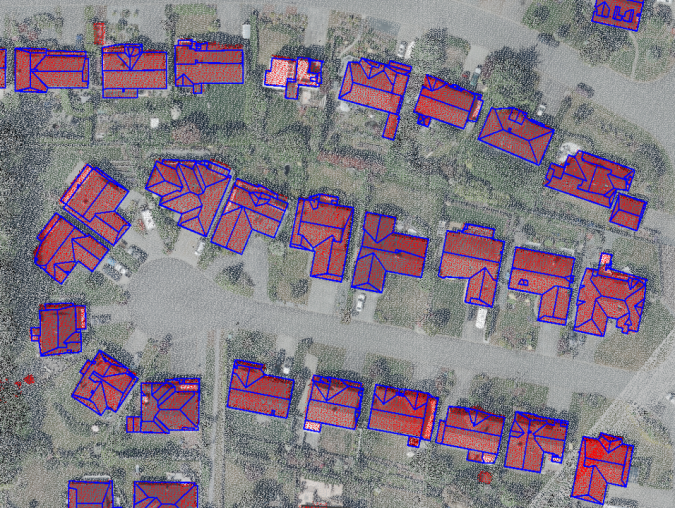
One of the major requirements of Level of Detail (LoD) 2.2 building model generation is building footprint layers. Primarily, the building footprints were extracted from Lidar data in a multi-step process including rasterization, polygonization and regularization. To refine the building footprints layer, as well as benefit from another data source to perform a quality check on both the extracted building footprints and the Lidar classification, we used a pre-trained Mask-RCNN model to detect buildings from aerial images.
Building footprints extracted from the imagery were overlaid on Lidar data, and both the misclassified Lidar points and the building footprints were modified accordingly.
Conclusion and recommendation
Employing AI-based methods in industry-level projects requires a well-constructed workflow with robust datasets. In this article, we first trained a deep learning model to classify building points in aerial Lidar data using a very high-quality dataset from Nanaimo. Although the trained model obtained acceptable results on a dataset from the same area that the model was trained with, it failed to achieve a high accuracy prediction due to different characteristics of the new dataset. This poor performance of the deep learning model on the Vancouver dataset meant that the model was not sufficiently generalized. It is therefore recommended to improve the generalization and transferability of the trained model to enhance the Lidar prediction quality on various structure types by providing more training data.
Acknowledgement
The authors would like to thank the cities of Nanaimo and Vancouver for providing Lidar data.

Value staying current with geomatics?
Stay on the map with our expertly curated newsletters.
We provide educational insights, industry updates, and inspiring stories to help you learn, grow, and reach your full potential in your field. Don't miss out - subscribe today and ensure you're always informed, educated, and inspired.
Choose your newsletter(s)


