Robotic Theodolites (RTS)
Measuring Structure Excitation
Robotic theodolites, the new generation of the well-known surveying theodolite, are used to measure deflections in short-span bridges with millimetre accuracy. This permits the coming true of an old dream for engineers: to be in a position not only to predict, but to measure the excitation of engineering structures due to dynamic loads such as wind and traffic, and hence evaluate their structural health.
Electronic theodolites or total-stations (TS) are very common survey instruments used to compute the Cartesian coordinates of selected points marked by a usually prismatic reflector. A TS emits a modulated IR ray to the reflector, measures ‘time-of-flight’ (TOF) of emitted ray, and reflects back to the TS and computes the distance to the reflector. In addition, it measures zenithal and horizontal angles of the sighting point relative to a selected point. Measured polar coordinates of the point marked by the reflector are subsequently transformed into Cartesian coordinates relative to a selected reference system, with millimetre, and even sub-millimetre accuracy.
Robotic theodolites or Robotic Total Station s (RTS) are a new version of TS. They are able to track a moving reflector with a frequency of measurement up to between 5-10Hz, or to be programmed to sight at selected reflectors at predefined time intervals. Because of their advantages, RTS are widely used in numerous surveying and other engineering projects.
Pushing the Limits
Systematic experiments have shown that, except for common engineering surveys, RTS can be used to record even high-frequency (>1Hz) and small-amplitude (a few mm) oscillations, and hence be used for the monitoring of major engineering structures excited by the wind or traffic load, or for measuring movement of various objects (Psimoulis and Stiros, 2007). In particular, it has been shown to be possible to ‘push the limits’ of these instruments. First, using upgraded built-in software, the time of each measurement is recorded with a resolution of 0.01sec, instead of the usual 1sec. This allows the disadvantage to be overcome of currently marketed RTS: the jitter effect, instability of the instrument sampling rate near its maximum recording level, a common problem in most electronic devices. Secondly, analysing data using a specific spectral-analysis technique based on least squares. This technique permits estimation of dominant spectral peaks of non-uniformly distributed data without the introduction of errors from prior interpolations. Since such data are free of the limitations imposed by the Nyquist criterion, using a RTS with a real average sampling rate of 5-7Hz, significant dominant frequencies, even above 3-4Hz, can be computed (Pytharouli and Stiros, 2008).
An Engineer’s Dream
Various engineering structures (tall buildings, bridges) swing when excited by earthquake, wind and traffic load; London’s pedestrian Millennium Bridge, which had to be closed soon after inauguration for costly repairs, and the collapse of the Tacoma Narrows Bridge in America are two notorious examples. Engineers can ‘predict’ the response of a structure to certain excitations using various computational techniques, but they cannot verify that the real structure (‘as-built’) is identical with the designed structure. This is because there has been no method of measuring the response of a structure to test excitation, and in particular of measuring displacement with reference to a certain coordinate system independent of the studied building or bridge.
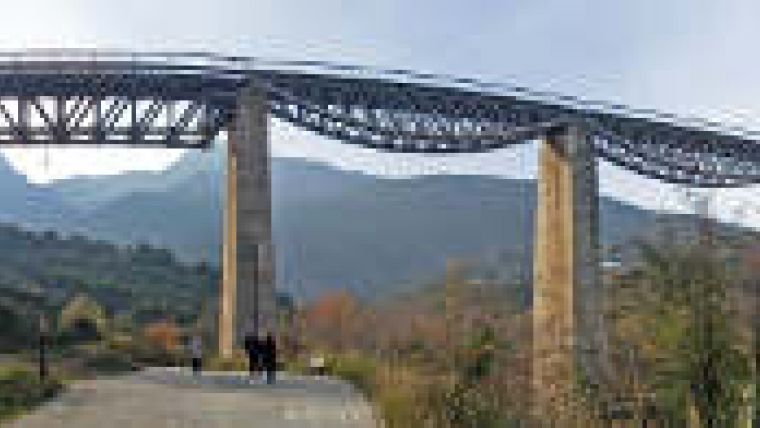
Gustav Eiffel was the first to try to solve this problem in the 1880s, using common theodolites to observe wind-induced deflections of the top of his Tower in Paris. Still these instruments could record only very slow, ‘semi-static’ deflection, not high-frequency movements. For more than a century this same problem remained unsolved for engineers, until the advent of new generation of geodetic instruments, GPS and RTS. The former requires an unobstructed view of satellites, and has been successfully used in the study of high-standing buildings and bridges with a rectangular section and the bridge deck on its lower part. However, GPS cannot be easily used to measure the response of short, beam-type bridges, or bridges with a truss beneath the deck, as is the case with the Gorgopotamos Bridge (Figure 1) in central Greece. This is because the view to most satellites is blocked and signals are deformed by the passing train, so that the error in computed coordinate changes becomes too great to record small-scale oscillations. RTS provides an alternative for such cases.
Train Passing
Using engineering computational techniques, the response of a bridge to a passing train can be predicted. For instance, Figure 2a shows the predicted behaviour of the 30m long, high-strength Antoing Bridge (part of the Paris-Brussels high-speed railway) when a high-speed train with ten wagons passes. This pattern of displacements is characterised by an overall lowering of the bridge due to the weight of the train (semi-static displacement) and superimposed oscillation cycles equal to the number of wagons. It is a pattern typical for most train bridges; only the amplitude of displacement changes, depending on rigidity of the bridge and train characteristics (velocity, weight, dimensions etc). Hence a displacement pattern similar to that shown in Figure 2a is expected also for each of the openings of the Gorgopotamos Bridge; still, for a bridge more than a century old, much larger displacements than that of the Antoing Bridge are to be expected.
Gorgopotamos Bridge
The Gorgopotamos Railway Bridge in central Greece is a historical monument consisting of seven spans, with a total length of 211m. It is a composite structure, with a truss deck and pylons of steel and masonry. It was constructed in 1905 and twice, in 1942 and 1944, destroyed and re-built. It is still in use. Due to its previous partial reconstructions, no information on its dynamic characteristics is available or easily obtained using typical analytical techniques. Still, there is evidence that this bridge swings: when trains pass over it drivers report feeling a swing above its 30m-high pylons; they have to slow down over a long distance.
An effort to study the response of the Gorgopotamos Bridge to passing trains using RTS was made by the Geodesy Lab of the Department of Civil Engineering at Patras University in Greece. A high-quality prismatic reflector was clamped to the middle of the central span on the handrail, which is rigid enough to describe movements of the deck. Another reflector was fixed on the top of the pylon. In the first instance, a displacement history such as that predicted by Figure 2a is expected. In the second, no real movement is expected.
A Leica 1201 RTS with upgraded built-in software was set up on stable ground about 150m away from the bridge (Figure 1), and the coordinates of one of the reflectors were recorded each time before, during and after the passing of several trains. Measurements were made with an (unstable) rate of 5-7Hz, the maximum real rate of this instrument. Analysis of the obtained data revealed that the reflector above the pylon showed no statistically significant displacement, just noise. In contrast, the reflector in the mid-span showed typical noise before and after the passage of the train (transient, short-wavelength peaks with amplitude 1-2.6mm), and a more consistent signal in between, as revealed by a representative diagram from a freight train with eight wagons in Figure 2b. The zone with amplitude ± 2.6mm hence defines the noise level in the data, and peaks from this zone clearly indicate a statistically significant signal; displacement of the order of 6mm.
A New Era
This signal is certainly not perfect, thanks to the low sampling rate and noise in the data, and is also affected by clipping (loss of certain parts of the oscillations). Still, it shows a consistent pattern, with an overall lowering and eight oscillation cycles, equal to the number of passing wagons. The following lines of evidence indicate that the recorded displacements of Figure 2b clearly describe the response of the bridge to the train load: first, as expected, no displacements were measured at the pylon, while at the mid-span of the bridge the signal of displacement was statistically significant, with amplitude 6mm, exceeding the amplitude of the zone of noise, 2.6mm (Figure 2b). Second, the patterns of the predicted (Figure 2a) and of the observed (Figure 2b) displacements are similar; the number of recorded peaks was equal to the number of wagons.
The above discussion indicates that the robotic theodolite, along with the GPS, permit the opening up of a new era in engineering: allowing measurement of the displacement of major structures excited by dynamic loads such as wind and traffic and comparing their predicted and real behaviour to evaluate structural health.
Further Reading
- Psimoulis, P. and Stiros, S. (2007). Measurement of Deflections and of Oscillation Frequencies of Engineering Structures Using Robotic Theodolites (RTS), Engineering Structures, 29 (12), pp3312-3324
- Pytharouli, S., Stiros, S., (2008). Spectral Analysis of Unevenly Spaced or Discontinuous Data Using the ‘Normperiod’ Code, Computers and Structures, 86(1-2), pp190-196
- Xia, H., and Zhang, N. (2005). Dynamic Analysis of Railway Bridge under High-speed Trains, Computers and Structures, 83, pp1891-1901

Value staying current with geomatics?
Stay on the map with our expertly curated newsletters.
We provide educational insights, industry updates, and inspiring stories to help you learn, grow, and reach your full potential in your field. Don't miss out - subscribe today and ensure you're always informed, educated, and inspired.
Choose your newsletter(s)


