Satellites for Multiple Asset Structural Monitoring
InSAR and BIM
The concept of Satellite Structural Health Monitoring (S-SHM) was conceived as a new way of analysing and understanding the behaviour of assets and infrastructures as a whole, integrated in their ecosystem.
Critical infrastructures such as nuclear power stations, LNG terminals, railways and motorways in critical locations cover vast sites that have to be efficiently monitored and, on many occasions, heavily instrumented in specific locations as a reaction to a known failure or repair. Sometimes, construction on large sites can affect or jeopardize operations on older infrastructures adjacent to the site. In addition, the fact that there are so many surveying instruments and monitoring solutions on offer makes it very difficult for asset managers to choose one and, if more than one, to connect the vast amount of data to enhance infrastructure maintenance. Every instrumentation system is tailored to a specific purpose, to measure in a specific direction, with certain frequency, or to survey in very specific locations. This means that the overall asset and infrastructure behaviour is often missed. Likewise, by just looking at the big picture, the detail can be lost.
What If...?
However, wondering, as engineers do…
What if we could measure motion from a high density of fixed positions entirely remotely and assess this motion through time in a cost-effective way? Could we also integrate measurements of a specific asset, asset components or ground dynamics to analyse behaviour all in one system?
And, what if those measurements were linked in such a way that they didn’t just show displacements and structures affection in a location, but also gave rise to a detailed temporal understanding of the behaviour of the entire structure?
What if it could raise alerts for early warnings or, even, what if we could predict failure?
How might a Regulator feel if it was possible to undertake such analysis and gain insight on critical national infrastructures? To what extent did the structures in Fukushima, Japan or Ponte Morandi in Italy move? And what kind of threat is that to the life of the asset or even to human lives? We can never be really sure as the analysis was never undertaken in advance.
The concept of Satellite Structural Health Monitoring (S-SHM) was therefore conceived as a new way of analysing and understanding the behaviour of assets and infrastructures as a whole, integrated in their ecosystem. When built, infrastructures are conditioned by their structural quality and also by their physical environment: they are one entity. S-SHM is based on the integration and modelling of satellite derived measurements of displacement (InSAR) with a 3D Building Information Model (BIM), asset structural information and other sources of data such as geotechnics. This new capability is centred on the development of early warning and the prediction of structural deformation, allowing the asset condition to be highlighted and aiding decision-making for multiple assets management.
Case Studies
This new approach has been adopted for two critical infrastructure sites:
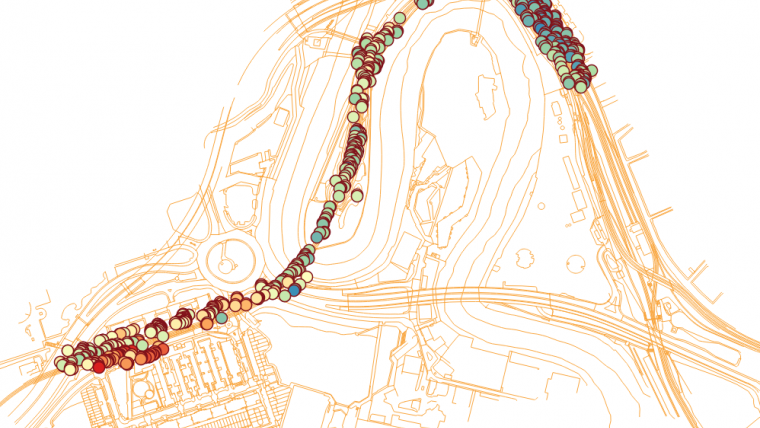
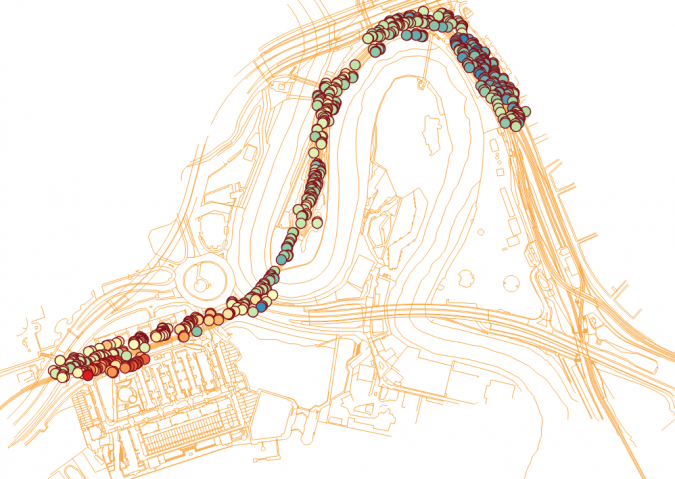
East India & Canning Town stations (London) for Transport for London (TfL). S-SHM was applied to the connecting railway track and surrounding regions with historical InSAR HR (High resolution) surface movement data from 2011-2015 from the COSMO-SkyMed StripMap (3m/pixel resolution) radar satellite. Outputs provided an independent validation of the S-SHM concept. Amber and Red thresholds were exceeded between October 2013 and May 2014, which was validated by a TfL assessment report identifying surface ground movement greater than predicted from the indicative scheme. This was due to dewatering between late 2013 and early 2014 in the vicinity of the River Lea. It was detected using in-situ sensors and had raised red triggers around the area.
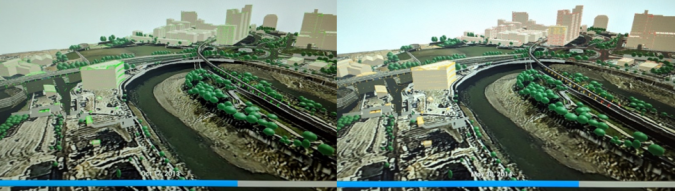
Figure 1 shows the visualisation of InSAR surface movement on 17 October 2013 and 28 March 2014 in the same location, showing the variation of assets stability in green to exceeding the threshold of subsidence in red.
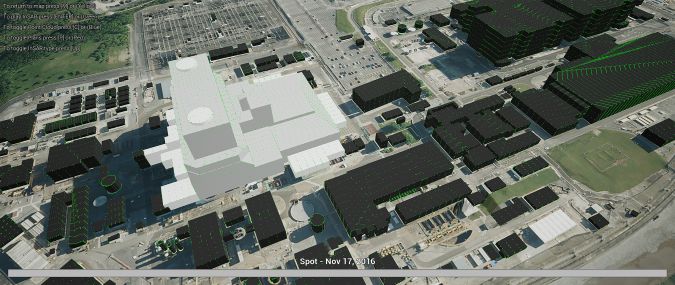
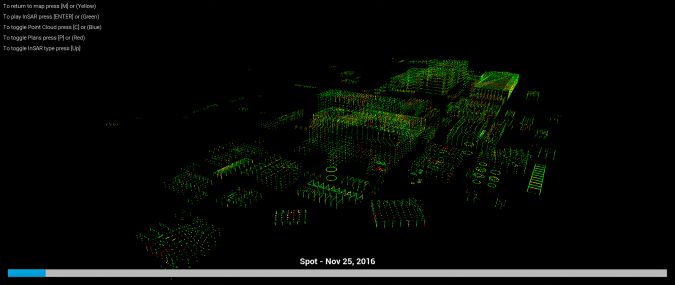
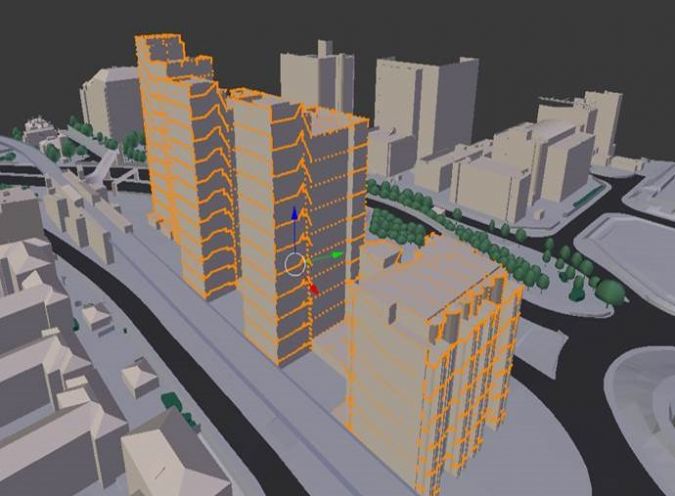
Hinkley Point nuclear power station (EDF), where the structural health of the three lifecycle stages of the Nuclear Power Station were monitored: construction (Hinkley Point C-HPC), operations (Hinkley Point B-HPB) and decommissioning (Hinkley Point A-HPA). S-SHMTM analysis was performed on the structures of HPA and B, showing overall stability of the structures and some subsidence developing towards HPA caused by dewatering activities occurring in the HPC construction phase. However, while these observations could not be validated due to the unavailability of local onsite measurement data, the overall S-SHM method did show the future of surveillance of large critical infrastructure assets such as nuclear power stations.
Figure 2 below shows the structures in HPA and Figure 3 the projection of the PS (Permanent Scatterers) measurement points on those structures.
S-SHM Methodology
The S-SHM process combines InSAR data with 3D model information by means of feature identifiers and classifying InSAR data into customizable groups and scenarios. This allows a series of structural health tests to be performed. Warnings are given when specific persistent scattering (PS) measurements exceed customized thresholds.
S-SHM takes the analysis beyond the 2D environment by incorporating InSAR into structural stability algorithms that allow asset condition to be highlighted, thus aiding asset management of multiple assets. This is an extremely powerful transformational capability for asset managers of large estates. The combination of satellite displacement measurement data with BIM and structural modelling ensures that the satellite derived data can be directly actionable - the results provide not only information on displacement but also on the health of the structure. S-SHM can achieve a lower per-asset cost by sensing from the satellite rather than placing in-situ sensors. However, the integration of measurements from other surveying systems along with InSAR will increase the richness of the assessment on asset health.
In the configuration phase, all input data is gathered and configured. The input data mainly consists of information about the assets and surrounding areas from the Asset manager and topographic Maps (TM). Data over the Area Of Interest (AOI) is acquired in this phase. Satellite imagery over the AOI may be acquired before and/or during this phase in order to establish the InSAR baseline. The gathered input data is ingested into a relational database.
In the alignment phase, alignment is performed between 3D model geometric data sets, InSAR data sets and topographic data sets. Figures 4 and 5 show InSAR data set alignment on the 3D model and on the TM Topographic lines.
In the classification phase, classifications of InSAR data points with respect to a Group of Features take place. These Groups of Features are formed by 3D model and TM features which are customizable from using python scripts.
In the test phase, the classified data is put through the pre-defined tests such as Line of Sight (LoS) displacement analysis, time series analysis or other complex tests. Tests can be related to health condition, routine monitoring and also the prediction of structural health. The outputs are presented in a format that can be viewed in 3D visualisation capability. The set of tests can be defined after consultation with the user. To perform a test on each InSAR point of its LoS displacement, RAG (Red, Amber, Green) thresholds are defined. When the absolute value of a PS measurement on a particular date exceeds the threshold assigned to the RAG, then the InSAR is flagged. This is the basic test on LoS displacements within a scenario. Additional tests can be developed and added to the software.
This video shows the visualisation of the East India & Canning Town DLR stations (London) for Transport for London (TFL).
S-SHM is scalable and can be updated to include any structural tests such as uniform raising/lowering of particular structures or single faces, a very strong uptrend of measurements with respect to its baseline, up bias of measurements with respect to its baseline, stable measurements with respect to its baseline, down bias with respect to its baseline, a very strong downtrend of measurements with respect to its baseline and oscillations with respect to a baseline.
One of the key conclusions of the work has been that the remotely sensed structural health of multiple assets is not only feasible, but it also provides high quality and reliable outputs on structural health and the surrounding regions. It can be implemented without the need for in-situ instrumentation; however, the more data integrated, the more robust the understanding of infrastructure behaviours will be. This approach is particularly useful for difficult-to-access and hazardous environments such as nuclear power stations, chemical plants, offshore locations and other extreme environments.
As mentioned at the beginning of this article, assets and infrastructures cannot be studied in isolation to fully assess their resilience; the surrounding environment has to be part of the condition analysis of this symbiotic relationship. This is the next development in this innovative approach to completing the structural heath analysis of the assets within the natural environment, looking at both the direction impact caused by natural processes such as landslides, flooding, seismicity, karstification, and soil mechanics. The cycle will have been completed when the whole infrastructure ecosystem has been built up as a Digital Twin, where the past, present and future behaviours can be analysed.
ACKNOWLEDGEMENTS
Tariq Dawood from EDF and Mark Bush from TFL for their continuous support in the implementation of new technologies for current critical infrastructure challenges.
To Innovate UK whose grant funding was used in the development of S-SHM contributing to the UK Digital transformation of Infrastructures.
Project partners: STLTech, TWI, and in particular ThinkLab (University of Salford) who were responsible for the 3D visualisation.
Andrew Iwanoczko for his always invaluable advice on the English language for giving the right tone to publications.
FURTHER READING
Shawn B (2005) Practical Issues in Real-World Implementation of Structural Health Monitoring Systems, Shawn J. Beard et al, SPIE Smart Structures and Materials + Nondestructive Evaluation and Health Monitoring.

Value staying current with geomatics?
Stay on the map with our expertly curated newsletters.
We provide educational insights, industry updates, and inspiring stories to help you learn, grow, and reach your full potential in your field. Don't miss out - subscribe today and ensure you're always informed, educated, and inspired.
Choose your newsletter(s)


