Scanning a WWII German Bunker Complex
Ocean Technology Student Survey Project
Every June, the first and second-year students of ocean technology (hydrography) at the Maritime Institute Willem Barentsz (MIWB) do a two-week field project around the institute’s campus, located on the coast of the Dutch Wadden island of Terschelling. The project is usually a bathymetric survey of nearby lakes, the harbour or surrounding waters. This year, one of the groups was offered an unusual challenge: to map the bunkers at the ‘Tiger’ bunker complex. The geodetic survey, uncommon for hydrography students, was met with enthusiasm and dedication by the survey team.
(By Raoul Michels, Maritime Institute Willem Barentsz (MIWB), The Netherlands)
The survey objective was to scan (part of) the Tigerstellung bunker complex just outside the town of West-Terschelling. During the Second World War, this outlying fortress guarded the northern aerial routes into and out of the Third Reich, covering much of the southern North Sea. It was used in the assault on England known as the Englandspiel. Buried in dirt in the fifties, the entire complex – comprised of bunkers and anti-aircraft guns in defence of the radar installations and listening posts that were highly advanced for their time – is now being excavated to broaden public awareness of its historical importance. Over the last few years, islanders and student volunteers have worked hard to uncover many bunkers and restore them to how they would have looked some 70 years ago.
As the MIWB does not own a laser scanner, the expertise and equipment had to come from the mainland. The students were aided by Mr Jos Westra from Coenradie BV who brought along a state-of-the-art Leica P40 laser scanner and arranged temporary licences to 3DReshaper from Technodigit for data processing. In view of the time constraints, it was agreed to completely map two bunkers (outside and inside): the command bunker (20 by 20 metres, two floors and about 15 rooms), and an anti-air bunker or ‘FLAK bunker’ (8 by 12 metres, one floor, six rooms).
Fieldwork
The party consisted of 13 members: six second-year and seven first-year students. This setup allowed the first-year students to learn from the second-year students whilst allowing the second-year students to gain more project management and leadership skills. Before the measuring work could start, four base points had to be determined near each bunker. This required the group to obtain the true three-dimensional coordinates in the searing 39°C heat with an inexperienced crew, no GNSS reception and only two known base stations within ten kilometres. It took several attempts to get it right. Just next to the bunker complex there was a mast continuously emitting radio signals, which interfered greatly with the reception of GNSS data.
There were two alternatives to finding the precise location in the 2D plane: either to use both polygon and eccentric measurements from two nearby control points, or to use the steeples of the churches on the mainland in Seisbierrum and Harlingen (about 24 kilometres away). The students tried both methods, but it was quickly determined that the steeple measurements were far too inaccurate to precisely determine the position of the bunkers in the 2D plane. Around the project locations of West-Terschelling two control points are accurately measured in the Dutch National Grid: the Brandaris lighthouse and the Dutch Ordnance Datum benchmark near the tidal station in the harbour. All other geodetic points are benchmarks with solely a height assigned to them. Both control points are roughly one kilometre away from the bunker complex. Due to the hills and dunes surrounding the bunkers, several eccentric and polygon measurements with a total station were required. Height was determined by levelling between one of the many benchmarks to the chosen base points around the bunkers. Geodetic calculations resulted in a total vertical precision of three millimetres and a total horizontal precision of about 15 to 20 centimetres. The horizontal precision was not great, but it was deemed good enough for the visualisation.
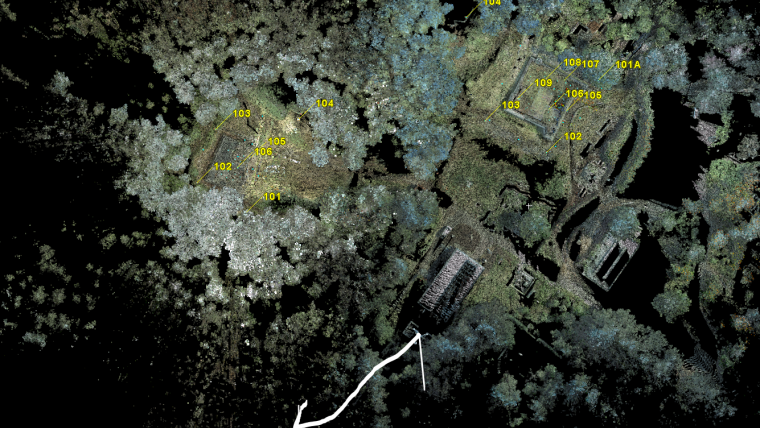
The reflectors – fifteen in total – were distributed on and around the bunkers (Figure 1) to ensure that every-angle scans always included at least two reflectors. All the scanning was done and the raw data obtained within a two-day period. The outsides of both bunkers, as well as the officers’ mess in the command bunker, were mapped in full colour. The lack of light inside the bunkers meant that most chambers could not be measured in full colour, so simple 3D scanning was performed on these rooms.
Data processing
After the data had been collected, it was first analysed by Mr Westra using the Leica Cyclone software. This allowed the aggregation of different scans into a single file. During the next week, the students processed the Cyclone file into a single coherent image, using 3DReshaper and AutoCAD. What made the processing especially difficult was the amount of grass on top of the command bunker. Although great for camouflage, it hindered the processing of the laser-scanned point cloud. The full-colour scans were processed into high-detail pictures of both bunkers. The simple point clouds inside were transformed into a three-dimensional mesh using 3DReshaper.
Conclusion
Three days of preparation, two days of measurements and five days of processing culminated in the presentation of the survey results to the other students and several of the volunteers working at the bunker complex, during which the students presented the map and 3D images of the bunkers. The presentation included an ochre 3D mesh of the FLAK bunker and a point cloud of the interior of the command bunker, among other things. For the students, it was an exciting and challenging project. With their theoretical knowledge of geodetic basics and a limited amount of field practice, they concluded that this opportunity to do an entire project themselves was well worth the time spent on dry land instead of doing the usual bathymetric survey.
Acknowledgements
Thanks are due to Coenradie BV and Technodigit for supporting this survey with equipment and time. Also many thanks to my fellow students for collecting and processing the data shown here.
About the Author
Raoul Michels has just completed his second year of studying ocean technology at the Maritime Institute Willem Barentsz and led this bunker project.
Figure Captions
Figure 1, Reflectors near the FLAK bunker (left) and Command bunker (right). All full-colour scans have been overlaid to create this picture.
Figure 2, The Tigerstellung command bunker – visual (above) and full-colour point cloud (down).
Figure 3, 3D mesh of the FLAK bunker and interior point cloud of the Command bunker.

Value staying current with geomatics?
Stay on the map with our expertly curated newsletters.
We provide educational insights, industry updates, and inspiring stories to help you learn, grow, and reach your full potential in your field. Don't miss out - subscribe today and ensure you're always informed, educated, and inspired.
Choose your newsletter(s)


