An Operational High-resolution Forest Inventory
Combining State-of-the-art Remote Sensing with Computer Analytics
Forestry operations currently rely heavily on forest inventories that employ field plot data as a basis for estimating forest attributes. This labour-intensive approach provides limited information and has become a costly bottleneck in completing operations. Remote sensing can be used to obtain more accurate and comprehensive forest inventories with less effort. This article discusses high-resolution forest inventory services (HRISs) which combine state-of-the-art remote sensing technologies and computer analytics to produce operational forest inventories that help to improve the efficiency of various forest management activities.
As a global economic activity, forest wood production is highly variable, ranging from single species plantations to low-impact, sustainable forest management projects in natural forests. In all cases, employing forest inventories to quantify existing forest resources within a given area is critical for scheduling forest management activities, valuation, planning, compliance with governmental regulations and decision support.
Data deficiencies
In the province of Alberta, Canada, forestry inventories include estimates of land cover class, species composition, site productivity class and structural attributes including forest height, crown closure, density and stand structure complexity (e.g. indicators of single cohort or multi-storey stands). This approach to forest management is considered to be sufficient for high-level strategic management planning, but with its low resolution and high uncertainty it is unsuitable for use at the local scale. Additional reconnaissance and ground sampling are required to make up for these data deficiencies.
Intensive plantations
A different approach is used in jurisdictions that are oriented towards more intensive plantation management practices. In Brazil, for example, more dense sampling is applied in eucalyptus plantations where plant growth rates are amongst the highest in the world; thousands of field plots are often established and/or measured to represent each and every plantation on an annual basis. Such heavy reliance on field crews can easily become a source of inefficiencies, resulting in high costs and long lead times to complete ground sampling tasks. In addition, as the number of ground samples increases, the level of uncertainty with respect to the representation of the attributes decreases. Expectedly, companies therefore want to reduce the number of field plots to a minimum, while maintaining a high quality of information about the state of the forest at the (local) scale of individual plantations.
Labour to technology
The potential of using a variety of remote sensing technologies has changed both of the aforementioned high-level and local-scale scenarios. Whether Lidar, radar, and/or optical imagery, airborne or satellite, and alone or combined, these sensors are becoming increasingly affordable and available all over the world. As remote sensing techniques are able to cover a large area for intensive sampling without the disadvantages that are inherent to labour-intensive ground sampling schemes done by field crews, they can provide observations and measurements at a fraction of the required time and effort. However, these advances from labour to technology require: 1) the ability to ensure that remote sensing data corresponds quantitatively with changes in landscape characteristics and forest attributes in both space and time; 2) that the large amounts of data generated for such forest inventories are handled in a timely and efficient manner with an operationally significant reduction in error; 3) that the results are consistent and can be reproduced; and 4) that the inventory itself becomes an integral part of forest operations taking maximum advantage of the new information. Tesera Systems Inc., a Canadian company, has been working with Blom Finland for companies in Western Canada to develop a high resolution forest inventory service (HRIS) that uses a combination of Lidar and colour infrared (CIR) imagery as well as available climate data to provide a complete commercial forest inventory that fulfils the four requirements listed above. Blom provides expertise in producing Lidar and CIR metrics while Tesera uses this data in combination with ground truth and other sources of data to complete a forest inventory.
Site productivity analysis
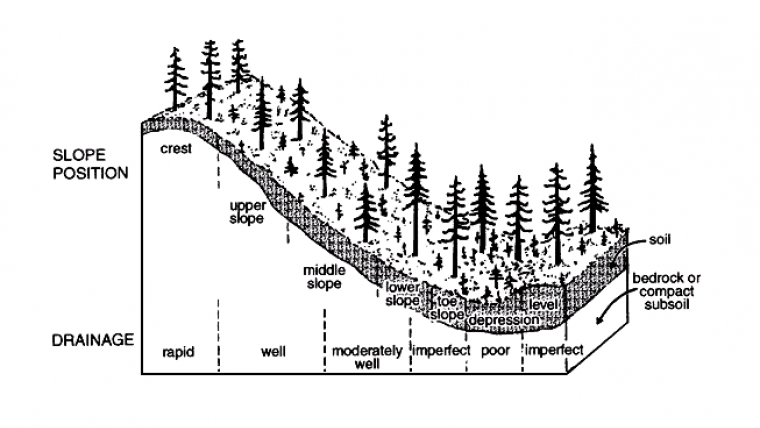
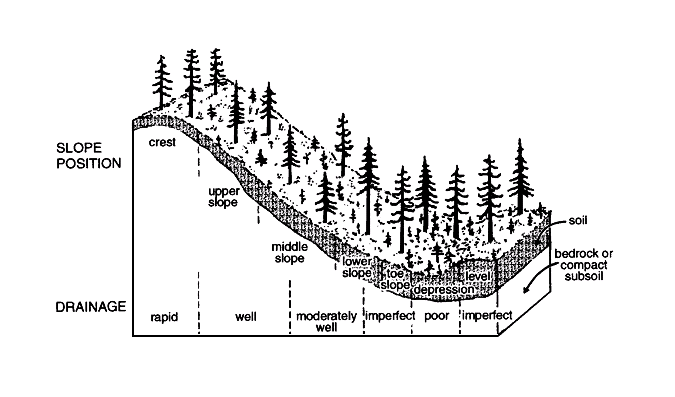
For the HRIS in Western Canada, Lidar data (of one pulse per square metre) and CIR imagery are obtained for entire project areas with resolutions in the order of 400m2 (these being referred to as grid cells) and 15 to 30cm ground surface distance (GSD). The HRIS uses field plot data to develop models for predicting forest attributes as a function of remote sensing indices. These models are in turn applied to fused Lidar-CIR data plus other types of grid cell data to estimate the same attributes for the entire project area. The process for generating this data and estimating the desired attributes is highly automated. For example, it is well known that slope position is an important variable for explaining differences in forest site productivity. Tesera adopted algorithms for use within a cloud-based computing environment starting with Lidar-derived digital elevation models (DEMs) to characterise slope position at any given location and at multiple scales. The results of this process are a set of ‘terrain indices’ that describe whether the location lies on a peak, in a valley or somewhere in between (Figure 1). They also pertain to differences relating to slope, aspect and elevation including interactions amongst these variables that may be important for explaining differences in site productivity. Primary discrete Lidar plus CIR indices are also derived from first, last and all returns for the purpose of estimating species composition and stand structure characteristics (such as height, volume, density, crown closure and stand age). Any other existing or derivable variable, such as soil type, could also be added into the dataset if available.
Cross validation
Because there is no a priori knowledge regarding the subset(s) of variables that best explain the forest attributes of interest, an automated variable selection algorithm is employed to obtain these variables. Once variables are selected, the HRIS develops predictive models to estimate the forestry variables of interest – e.g., basal area, tree diameter distribution, timber volume and merchantable volume – based solely on the selected variables. A series of computer routines are then applied to check for and remove any bias associated with attribute estimation. Before adopting any model, emphasis is placed on increasing the precision of estimates using statistical techniques such as take-one-leave-one and k-fold cross validation.
Precision and efficiency analysis
Gains in precision and efficiency obtained with the HRIS over conventional inventory methods can also be estimated by comparing HRIS estimates of, say, merchantable standing volume with those volumes that are actually produced after harvesting. In one such analysis in southwestern Alberta it was found that, as the area harvested within any given unit increases above 25 to 30 hectares, the coefficient of variation associated with merchantable volume generally reaches below +/-10%.
Microstands
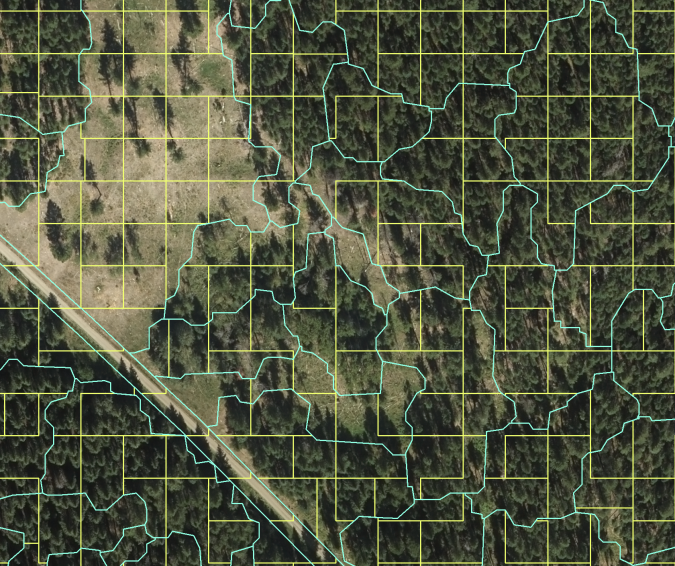
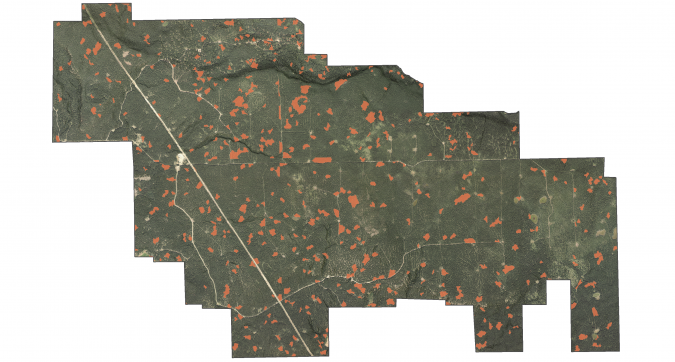
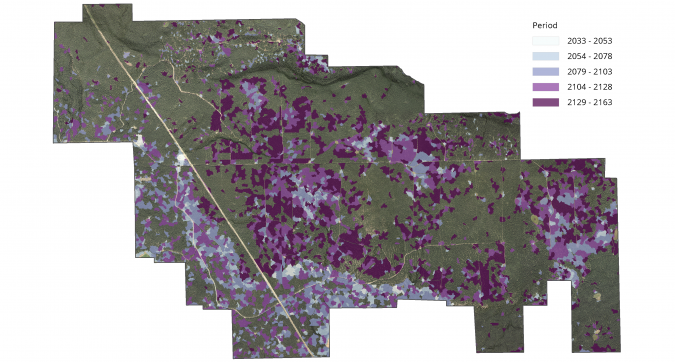
Another aspect of HRIS involves delineation of microstands, which typically are areas of 0.2 to 3 hectares in size (Figure 2). The polygons representing these areas are maximally homogeneous with respect to a set of key Lidar and CIR variables, for example with respect to canopy heights, and ratios of red to near-infrared reflections. Grid cells that cross microstand boundaries are separated along the boundary and then combined with another grid cell within the same microstand in an effort to reduce boundary effects. Once grid cells have been attributed with a complete set of forest inventory attributes, the results are summarised at a microstand level. Adjacent microstands may be further aggregated into larger units based on the degree of similarity in user-defined characteristics to produce the final inventory product. The outcome is a map with a population of microstands that can be themed based on the HRIS attributes to identify areas of importance for wildlife habitat or silvicultural treatments (Figures 3 and 4). This HRIS data can then be further extended to include associated growth and yield projections for operational, tactical and long-term strategic forest estate planning including net present value (NPV) and return on investment (ROI) calculations.
Independent of technology
Remote sensing solutions are evolving over time and there are many different technologies available, each with its own advantages and disadvantages. HRIS is independent of a particular remote sensing technology; it can utilise any available remote sensing data provided it generates quantitative information about forest attributes. Forest companies can thus choose to incorporate a particular remote sensing solution without major modifications to their processing chain – and thereby close the loop between high-level strategic planning and local ground-level activities.

Value staying current with geomatics?
Stay on the map with our expertly curated newsletters.
We provide educational insights, industry updates, and inspiring stories to help you learn, grow, and reach your full potential in your field. Don't miss out - subscribe today and ensure you're always informed, educated, and inspired.
Choose your newsletter(s)


