Classifying Buildings from Point Clouds and Images
Comparing Airborne Lidar and Dense Image Matching for Building Classification
The reconstruction of building outlines provides useful input for land information systems. In the city of Kalochori in northern Greece, a mixed commercial and residential area of 33 hectares was selected as a test area to evaluate the classification of buildings. Two data sources were available: airborne Lidar and aerial photographs. These data sources were processed to create two separate point clouds. Comparison of the results shows that both data sources can be used for building classification, although more development is needed to improve the robustness of dense image matching.
(By Evangelos Maltezos and Charalabos Ioannidis, Greece)
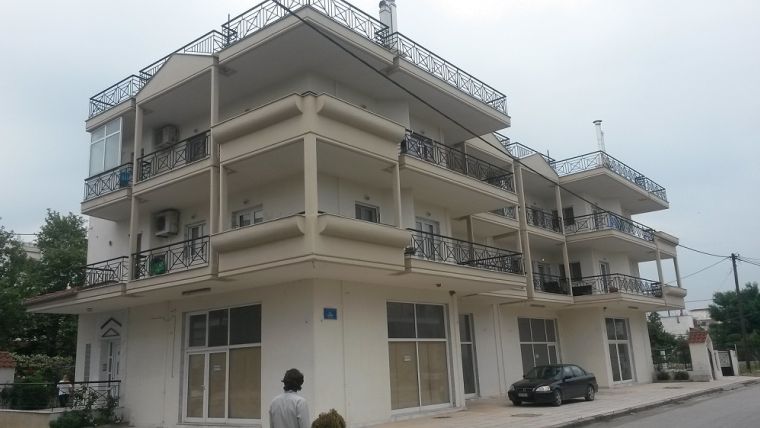
An urban area containing 501 industrial and residential buildings was used as the test site. The vegetation is characterised by moderate, long arrays or groups of dense trees between the buildings. Some buildings are partially occluded by high trees or have high vegetation directly alongside the building boundary. The buildings have a complex structure with sloping roofs, chimneys, solar water heaters and small extensions or major additions. Figure 1 shows a terrestrial image of a representative large building and its surroundings.
Lidar or images
The acquisition of accurate dense 3D point clouds in urban areas has long been based on airborne Lidar. The collection of Lidar data requires expensive hardware but, thanks to the rapid evolution of sensors and high-quality data, Lidar remains in wide use. Due to the nature of Lidar data, the point clouds have high position accuracy but occlusions and local undersampling may occur which may result in a lack of significant information for applications like 3D modelling. Computer vision technology can also automatically extract 3D information from digital imagery, provided that sufficient overlap is present in the images. These techniques apply dense image matching (DIM) which can extract an accurate and dense 3D point cloud by stereo matching. For each pixel in one input image, the DIM technique can effectively find the corresponding pixel in another image, allowing for the creation of a dense 3D point cloud. The quality of a point cloud from DIM depends on characteristics such as geometry of each stereo pair, radiometric distortions and complexity of the scene. DIM point clouds are usually of higher density compared to Lidar point clouds but also present rough surfaces and deformed boundaries of buildings due to mismatches or excessive interpolations. A stereo pair of colour-infrared (CIR) digital aerial imagery derived in May 2014 was used with an approximate overlap of 60% and a base-to-height ratio value of 0.30. A DIM/CIR point cloud was extracted applying the SGM stereo method using the ERDAS IMAGINE package. Table 1 depicts some relevant attributes of the two datasets.
|
|
Lidar |
DIM |
|
Data collection |
Raw point cloud |
A stereo pair of CIR imagery |
|
Sensor |
ALS 60 |
DMC camera |
|
Average point spacing |
40 cm |
20 cm |
|
Horizontal accuracy |
8 cm |
25 cm |
|
Vertical accuracy |
20 cm |
30 cm |
Table 1, Properties of the two datasets for building classification.
Clearing vegetation
As a first step of the procedure, vegetation was removed from the data. In the Lidar point clouds this was achieved using scanline smooth filtering. In this method, a normal vector is computed for all points in the point cloud. A normal vector is a mathematical representation of the slope of the surface that is represented by the point cloud. It points in a perpendicular direction. For instance, a flat rooftop will have a normal vector pointing upwards, while a vertical wall will have a vector pointing sideways. In vegetation, the normal vector is likely to point in many different directions for each vegetation point. The normal vectors were computed using the open-source package CloudCompare by triangulating the point clouds towards a mesh and taking the vectors perpendicular to the mesh triangles as normal vectors. Each value of the z coordinate of the normal vector was subsequently smoothed by averaging them with the neighbouring z coordinates of normal vectors in the same scanline. Now that the slope of the surface was known for each point, all points with a slope steeper than 30 degrees were removed. This corresponds to the maximum allowable value of a roof slope according to the Greek urban planning authority for typical cases of buildings. Possible remaining vegetation points could be eliminated using other metrics such as roughness, using the scanline smooth filtering technique to remove points whose roughness values are higher than 0.10m. The results are shown in Figure 2.
In the point cloud constructed with DIM, the same filtering process is not feasible. Due to errors that are inherent to DIM processing, surfaces become very rough and buildings outlines are shaped inaccurately. The near-infrared (NIR) channel is a very good source of information about the presence of vegetation. A common way to classify vegetation is to compute a Normalised Differential Vegetation Index (NDVI). It was calculated for each point as the normalised difference between the red and near-infrared values. The computed NDVI values were used to segment vegetative areas from the scene content by thresholding. The results are shown in Figure 3. In case of lack of NIR channel, machine learning techniques could be used to detect vegetation.
Ground filtering
The second step was the removal of the bare earth. Since the urban scenes rarely present a lot of relief, a morphological operator is suitable for the extraction of the bare earth. A sparse point cloud of the bare earth was obtained by selecting the deepest point inside a 120m window along the scanline of the point cloud. The window size depends on the expected size of the largest building in the area and was determined by visual inspection. Then, an integrated and comprehensive point cloud of the bare earth was extracted. First, a mesh was created using the sparse point cloud. Then, a dense point cloud of the bare earth with the same point density of the initial point clouds was created by sampling on mesh. The bare earth points of the point clouds cleared from vegetation were removed using a closest point technique in CloudCompare.
Clean-up
Once vegetation and ground had been removed, the buildings were extracted. Only points with normalised heights above 2.5m were considered as buildings to avoid low vegetation, fences, cars, etc. Finally, the density of each point was calculated using a search area with a 2m radius. Clusters that were too small to be a building (fewer than 20 for the Lidar point cloud and fewer than 55 for the CIR point cloud) were removed. Figure 4 shows the resulting buildings as identified from the Lidar data and the DIM data.
Results
In the Lidar data, a 95% success rate of completeness and correctness was achieved. The omission error comes mostly from the powerful filtering of the scanline smooth filtering. Thus, together with the vegetation which was almost completely removed, local complex cases of small extensions or additions of large buildings were incorrectly removed, increasing the false negatives. The false positives that were observed were associated with remaining cases of dense and high trees. The above success rates show that simple and efficient filtering techniques which enhance the geometric properties of each point may be used to extract buildings from Lidar point clouds. Satisfactory success rates were also achieved in the DIM point cloud, with a completeness and correctness of 90%. The use of the NDVI removed the vegetation completely. However, false negatives and false positives were observed due to mismatches at complex cases of small buildings and excessive interpolations respectively. Compared to the Lidar results, the DIM approach achieved lower success rates due to its sensitivity in occlusions, complex scenes, radiometric differences and textureless areas. This results in deformed boundaries of buildings and rough surfaces. Thus, even though the two approaches have similar success rates, the quality of the detected buildings is not the same. This restricts the use of the DIM point clouds for further applications such as 3D modelling. This weakness may be overcome with more advanced algorithms. Under these conditions, the DIM point clouds may give promising results as the basis for accurate and cost-effective applications in 3D modelling, cadastre and urban studies.
Acknowledgement
This research was conducted within the framework of the ’5 Dimensional Multi-purpose Land Information System’ research project co-funded by the European Regional Development Fund and the Greek General Secretariat for Research and Technology.
Authors
Evangelos Maltezos obtained his BSc degree in civil engineering from the Technological Educational Institute of Patras, Greece, in 2007. He also received a BSc degree in rural and surveying engineering from the National Technical University of Athens (NTUA) in 2013. He is currently a PhD candidate at NTUA’s Laboratory of Photogrammetry and works for Geosystems Hellas S.A. His research interest lies in 3D reconstruction, object extraction and segmentation.
Email: maltezosev@gmail.com
Charalabos Ioannidis is a professor at the Laboratory of Photogrammetry, School of Rural and Surveying Engineering, National Technical University of Athens, Greece, where he teaches photogrammetry and cadastre. His research interests lie in the fields of computer vision, satellite photogrammetry, 3D modelling, change detection and cultural heritage documentation. He is chair of the Working Group 3.2 ‘Technical Aspects of Spatial Information Management’ of FIG Commission 3.
Email: cioannid@survey.ntua.gr
Further reading
Maltezos, E., Ioannidis, C., 2015. Automatic detection of building points from Lidar and dense image matching point clouds. In: ISPRS Annals of the Photogrammetry, Remote Sensing and Spatial Information Sciences, La Grande Motte, France, Vol. II-3/W5, pp. 33-40.
doi:10.5194/isprsannals-II-3-W5-33-2015

Value staying current with geomatics?
Stay on the map with our expertly curated newsletters.
We provide educational insights, industry updates, and inspiring stories to help you learn, grow, and reach your full potential in your field. Don't miss out - subscribe today and ensure you're always informed, educated, and inspired.
Choose your newsletter(s)


