CryoSat Extends Arctic Reach
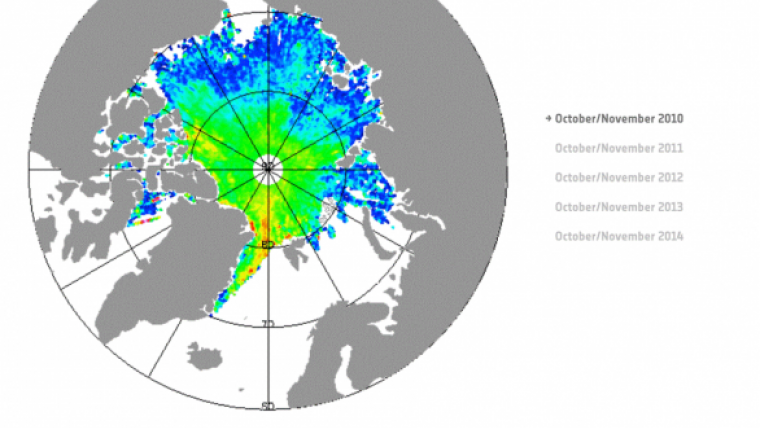
CryoSat has delivered this year’s map of autumn sea-ice thickness in the Arctic, revealing a small decrease in ice volume. In a new phase for ESA’s ice mission, the measurements can now also be used to help vessels navigate through the northern coastal waters of Alaska, for example. Measurements made during October and November show that the volume of Arctic sea ice now stands at about 10,200 cubic kilometres – a small drop compared to last year’s 10,900 cubic kilometres.
The volume is the second-highest since measurements began in 2010, and the five-year average is relatively stable. This, however, does not necessarily indicate a turn in the long-term downward trend.
It is important to take care when computing long-term trends as this CryoSat assessment is short when compared to other climate records, said professor Andrew Shepherd from University College London and the University of Leeds. For reliable predictions, other approaches should be tried, like considering what is forcing the changes, incorporating the CryoSat data into predictive models based on solid physics, or simply waiting until more measurements have been collected, he added.
CryoSat was designed to measure sea-ice thickness across the entire Arctic Ocean, enabling scientists to monitor accurately the overall change in volume. While the amount of ice normally fluctuates depending on the season, longer-term satellite records show a constant downward trend in ice extent during all seasons, in particular in summer, with a minimum occurring in the autumn of 2012.
Mission objectives
Establishing whether the ice volume is following a similar trend is one of CryoSat’s key mission objectives. A team of UK researchers at the Centre for Polar Observation and Modelling are presenting their findings this week at the American Geophysical Union’s autumn meeting in San Francisco, California.
October is interesting because it is the first month the researchers get data directly following the sea-ice minimum in September, so that is where they see the largest interannual variability in their volume estimates, said the Centre’s Rachel Tilling, who is working on the CryoSat measurements as part of her PhD studies.
Launched in 2010, CryoSat has long surpassed its planned three-year life. At the mission’s recent mid-term review, it was further extended until February 2017.
Tommaso Parrinello, ESA’s CryoSat Mission Manager, said CryoSat has already achieved outstanding results, both within its original mission objectives and for unexpected applications. Looking ahead, they are working hard to prototype new operational capabilities so that the measurements can be used for routine assessments in climate science and for services affected by Arctic sea ice.
To test this, scientists have produced an assessment of sea-ice thickness north of Alaska and eastern Russia with data acquired over the last month. Products like this could prove useful for maritime services, such as shipping and exploration.
The image shows the arctic sea-ice thickness in October/November (when the Arctic starts its post-summer freeze-up) 2010–14 based on data from ESA’s CryoSat mission. In 2013, CryoSat measured about 10,900 cubic km of sea ice. 2014 has seen a decrease to 10,200 cubic km, but this still represents the second-highest volume since 2010. Click the image to start the animation.

Value staying current with geomatics?
Stay on the map with our expertly curated newsletters.
We provide educational insights, industry updates, and inspiring stories to help you learn, grow, and reach your full potential in your field. Don't miss out - subscribe today and ensure you're always informed, educated, and inspired.
Choose your newsletter(s)


