Focus on Geoinformation Users
Cognitive and Use/User Issues in Contemporary Cartography
Maps have always been important for communicating geographic information to their users. However, although cartographers in the past may have conducted research into how people work with maps, they often did not have the resources to produce multiple versions of maps that had been redesigned based on their findings. Today, cartography is dynamic and interactive: maps change when users interact with them on online and mobile platforms. Producing maps is now easier and cheaper than ever before, and technology has opened up new possibilities for conducting better user research. The latter has ‘paid off’ on many occasions already, as illustrated by the design improvements to Google Maps for instance.
|
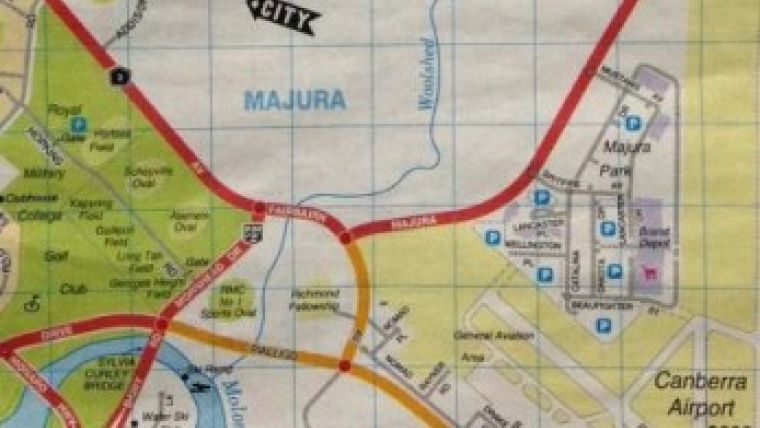
Figure 1, City street directories provide a top-down, overview perspective. |
Ultimately, all activities executed in the fields of geodata acquisition, storage, processing, analysis and dissemination are aimed at creating geographic information that human beings want or need in order to live their lives. Maps have always been important tools for communicating geographic information to their users. That is perhaps why cartographers have always been the geoinformation professionals who have paid the most attention to usage and user issues, or they have at least been the most aware of them.
Although, internationally, there were earlier signs of scientific cartographic research such as Robinson’s 1952 book The Look of Maps, many cartographers consider the publication Bertin’s Sémiologie Graphique in 1967 as the birth of cartographic science. In this publication, Bertin formulated rules for map and symbol design based on knowledge of the way in which his so-called ‘visual variables’ are perceived by human beings. His cartographic grammar undoubtedly led to improved designs and more effective and efficient geographic information transfer. However, Bertin never tested his rules through systematic experiments with map users.
While scientists paid increasing attention to map users from the 1970s onwards, throughout the 20th century practising cartographers themselves did not typically investigate their users’ behaviour. They did not have the resources to carry out substantial user research, and the difficulty and cost of producing several map iterations were further limiting factors. Certainly, though, map designers did make use of the outcomes of scientific
| Figure 2, GPS navigation systems provide an egocentric perspective |
map use research as reflected by an overall undisputed and steady increase in map design quality. But for a long time most of their energy went into coping with the extremely fast technological revolution, first in reproduction methods and thereafter in computing. As a consequence, many maps were not as effective, efficient and satisfying as they potentially could be.
In their article in the June 2013 edition of GIM International, Buchroithner & Gartner already demonstrated that the very same technological revolution has led to ‘a new face of cartography’ which is no longer a discipline of static maps. Now, it is much more dynamic and interactive: maps change when users interact with them on online and mobile platforms. At the same time, it is now less difficult and less costly to produce digital maps than ever before, and the technological revolution has opened up new possibilities for conducting better user research. The latter has already ‘paid off’ on many occasions. Think, for instance, of the success of a geographic application such as Google Maps, the appearance and functionality of which has been influenced by research among users.
Computing advances have changed everything for cartographic user research – not only in terms of making it more possible, but also increasing the need for it as we create new, more cognitively demanding modes of interacting with geoinformation. For these reasons, especially since the start of this century, the interest in cognitive and use/user issues in cartography is booming.
Cognitive Issues
As computing has changed what is cartographically feasible to produce, the design challenges cartographers face have become increasingly complex. Today, when cartographers create a dynamic, interactive map, they have to make decisions not only about which visual variables to use to represent the geographic phenomenon, but also about what type of map to create and how much control over the map the user should have. While dynamic maps have a ‘wow’ factor and are often eye-catching (quite literally) because of the human eye’s well-evolved capacity to detect motion, there is much that is not yet understood in terms of producing well-designed dynamic and interactive maps.
| Figure 3, Eye tracking in the labatory. |
Many of the problems involved in designing such maps relate to the fact that they can easily overwhelm the map user’s capacity to process and interpret the information presented. In other words, the mental effort required to read the map is too high. For example, while map readers may see much of the information presented within a dynamic map, they typically miss even more than they see – even if they know what they are looking for in the map. In particular, map readers are not very good at perceiving change – the very thing that dynamic maps are often designed to help them see. The problem of change blindness has been memorably demonstrated in everyday activities. In one study, a person who asks a passer-by for directions on the street is replaced by a completely different person, and yet more than half of the people giving directions did not notice that the person had changed [1]. This phenomenon also occurs within dynamic maps, especially when the map shows polygons whose values change over time rather than the movement of objects across space and over time.
While cognitive issues can influence how map users read maps, the use of either a physical or a digital map can also affect how map readers think about space – their ‘spatial cognition’. For example, while wayfinding (navigating from one location to another) used to be supported primarily by paper maps which provide a top-down, overview perspective on space (Figure 1), people are now commonly finding their way using GPS and GPS-linked maps in their cars or on their smartphones. Such maps typically present space with reference to the user’s location, whereby the user is explicitly located on the map – an ‘egocentric perspective’ (Figure 2). Researchers studying the role of map type on the characteristics of mental maps that users develop for a particular place have discovered that, for example, GPS users navigate more slowly and develop poorer-quality mental maps (in terms of understanding the locations of buildings or other places relative to each other). Hence, it is becoming increasingly important to not only understand how maps work for map users, but also to understand how using maps can change the way people think and move around.
Additional Use and User Issues
The cognitive issues relevant to use very much depend on context – who the user is, what they are doing with the map, how their map use relates to other tasks they are trying to accomplish, the equipment/hardware being used, etc. This poses new research challenges which may be summarised under the following headings: broadening of scope, ‘produsers’, requirement analysis, and methods and techniques of use and user research.
As the example above of using interactive GPS maps for navigation shows, the scope of use and user research in cartography must be broadened. Map displays themselves can no longer be the only object of research. Interactive and dynamic map displays are embedded within complete GI systems. Therefore in user research it is critical not to disconnect the map display from its interface, the hardware, the software, the underlying database, etc. Moreover, geoprofessionals need to look beyond end users (i.e. those who obtain geographic information after it has been collected, stored, processed and designed). It is also important to pay attention to the use and users of tools for geodata acquisition, analysis (GIS) and map display generation.
Sometimes end users and producers are one and the same person. Indeed, thanks to crowdsourcing, Volunteered Geographic Information (VGI)
| Figure 4, User testing in the proper field context. |
and ‘neocartography’, we are seeing the rise of the so-called ‘produsers’: individuals who both use geographic data and contribute to its collection. In order to learn more about the usability of this data, more needs to be known about the different groups of people involved and how they use it, including those people who did not contribute to its generation but rather merely use the data collected and cartographically represented by others.
Another research challenge is the development and implementation of user-centred design methods in cartography. In the past, too much map use research was limited to usability research, i.e. a map display or other GI tool was first produced and then tested with users. Nowadays, it is necessary to first conduct thorough requirements analysis, establishing the geographic tasks to be executed and the geographic questions to be answered, before even starting to build a prototype. In terms of requirements engineering, a lot can be learned from the Human-Computer Interaction (HCI) community.
New Research Techniques
The HCI and other communities provide examples of how to implement a variety of new and existing methods and techniques of user research, both qualitative and quantitative. The options extend way beyond questionnaires and interviews. Practitioners and researchers are increasingly using observational methods and techniques such as thinking aloud and eye tracking (Figure 3). This popularity is not only due to the fact that new technology is available and accessible to researchers (a necessary condition, of course), but it has also been clearly demonstrated that different methods lead to different insights. Mixed methods approaches in particular now provide invaluable information about uses, users and usability.
The challenge lies in the fact that research methods and techniques from other domains cannot simply be unthinkingly applied, but instead should be modified to suit the study of geoinformation. The geoinformation community should apply these methods in situations in which users want to derive information from complex spatio-temporal data. For example, when testing a prototype of a new pedestrian navigation system, it is not just a matter of testing its interaction with the map display on the mobile computing device. In such experiments, which need to be executed in the proper field contexts, the links between the geographic reality around the pedestrian, the representation of reality on the device and the user’s mental maps must also be considered (Figure 4).
The Way Forward
This article has attempted to sketch some of the cognitive and use/user research challenges in contemporary cartography. The Commission on Cognitive Visualization [2] and the Commission on Use and User Issues [3] of the International Cartographic Association focus on these challenges in an inspiring international context. Ultimately, the commissions’ activities aim to contribute to the creation of more effective, more efficient and more satisfying (i.e. more usable) geoinformation products. Readers of GIM International are invited to follow (and perhaps participate in!) the activities of the Commissions through their respective websites.

Value staying current with geomatics?
Stay on the map with our expertly curated newsletters.
We provide educational insights, industry updates, and inspiring stories to help you learn, grow, and reach your full potential in your field. Don't miss out - subscribe today and ensure you're always informed, educated, and inspired.
Choose your newsletter(s)


