Improving Geomechanical Analysis with Terrestrial Laser Scanners
Solid as a Rock?
People often describe something hard and immovable as ‘solid as a rock’. But rock does not always live up to its reputation. Depending on its characteristics and local conditions, sections of rock may slip, slide, crumble or deform, with potentially serious consequences. Geologists study the geomechanical properties of rock masses to understand how they may fail. This is traditionally done by measuring the characteristics of the rock mass discontinuity sets by climbing the rock face or by using photogrammetry, but terrestrial laser scanning (TLS) has caught the attention of geologists as being a safer and more effective method. Read more about the use of TLS for geomechanical analysis in the Italian Alps.
(By Dr Andrea Tamburini, president and co-founder of IMAGEO, Turin, Italy)
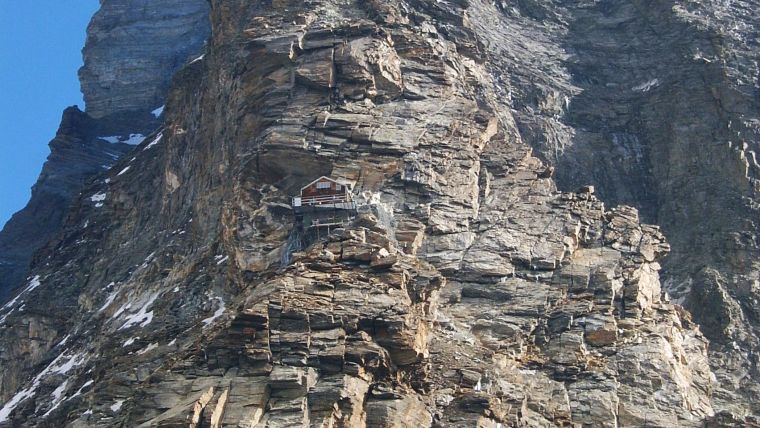
Peaking at over 4,000 metres in height, the Matterhorn is a famous landmark on the border between Switzerland and Italy. Climbers ascending the summit of this Alpine mountain along the conventional Italian route on the south-west ridge usually start at the Carrel Hut, a small building perched on a cliff. Unfortunately, melting permafrost has weakened the rock mass of the cliff, causing regular rock falls which occasionally even lead to closure of the route. This hazardous situation prompted the Fondazione Montagna Sicura (Safe Mountain Foundation, FMS) to ask the Turin University spin-off IMAGEO to analyse the nearby rock and determine the danger to the route and the hut. This activity was initiated within the framework of the PERMAdataROC Interreg III project in the summer of 2008. Surveying the Matterhorn is now done on a regular basis. Initially it was one of IMAGEO’s early chances to test TLS for this application, but the Alps remain an interesting research location for further improvement of the technology today.
Benefits of TLS
Compared to an on-site survey, the main benefit of using TLS is its range. Instead of having to climb around unstable rocks, researchers examining the unstable part of the Matterhorn around the Carrel Hut can set up the laser scanner (the Optech ILRIS TLS in this case) 400 metres away on the crest of the considerably safer and more accessible Testa del Leone. The TLS also proves superior to traditional photogrammetry thanks to the inherently 3D nature of its laser point cloud. The first step of rock mass geomechanical characterisation is to measure the geometric discontinuity parameters (dip and dip direction) in 3D, and a TLS can quickly cover the entire region of interest with millions of 3D laser points. Conversely, to derive 3D data from photogrammetry, one needs to shoot the mountain area from multiple angles and merge the image sets using triangulation software. This technique can be useful, but is much less accurate than TLS data and requires operators to set up reference points on the rock face in order to scale the 3D model, as photogrammetry is inherently dimensionless. In this particular case the only possible vantage point is the Testa del Leone, thereby precluding the use of terrestrial photogrammetry. Recent experiments have been carried out with cameras mounted on unmanned aerial vehicles (UAVs) to overcome these issues, but they cannot fully replace TLS surveys because UAVs generally have far shorter ranges and cannot easily operate in the windy and high-altitude conditions of the Alps. In favourable conditions, however, both methods can be combined successfully to improve the overall coverage since a UAV can capture rock ledges that a ground-based TLS may miss.
Dip and dip direction
As always, surveying is only half the effort. With the raw 3D data available, geometric features of rock mass discontinuities need to be extracted to identify the mountain’s weak spots. The first items of interest are the dip and the dip direction, as they show the location of potentially unstable rock volumes and their possible sliding mechanisms. Terranum Coltop3D is used to determine the local orientation of the slope for each point based on the surrounding points. Rocscience Dips is used to project the data onto a 2D stereonet. Statistical analysis of the data subsequently helps to group the measurements and obtain the orientation of the main discontinuity sets.
Rock fractures
In addition to the dip and dip direction, it is also important to understand the distribution of fractures in the rock mass because the combination of discontinuity sets creates removable blocks of different sizes and shapes. More fractures generally make for weaker rock, but geologists need to consider several other variables including their spacing, length and intersection. For the Matterhorn survey, each of these variables was measured manually in the past in a tedious and time-consuming task. This task has now been automated thanks to third-party software and custom algorithms. The first step is to turn the point cloud into a mesh using JRC 3D Reconstructor and then use a custom semi-automatic tool to detect the main fracture traces. These traces are then turned into polylines and exported as a GIS format before grouping them into discontinuity sets based on their orientation. Unfortunately, there is little off-the-shelf software available to map the frequency, spacing and intensity (P21) of fractures, as well as the elementary rock volume (Vb) and volumetric joint count (JV). Therefore, Esri’s ArcPy and GDAL (a set of open-source spatial libraries) have been used to develop custom algorithms to perform the required task. Finally, all the information about the dip and fractures are combined into a slope mass rating (SMR) map, an index commonly used for rock mass classification.
Improving automation
The data delivered so far has been of great use to FMS in supporting remedial work and as a monitoring solution. Based on this success, five to seven TLS surveys per year are now done in the Alps alone. Each survey helps to further improve the efficiency in the automation of data processing and analysis using the various software tools. TLS and the associated software tools are now also used in applications other than mountains, such as mapping rock slope stability along roads and railways. For example, an underground test survey has been performed for a mine operator to prove that TLS was suitable for surveying the tunnel faces. Surveying speed was of major concern here, as mining activities had to stop temporarily during the survey. The time required to map the rock faces was reduced by mounting the ILRIS TLS on a pickup truck to drive from tunnel to tunnel; it was possible to scan each tunnel face in just seven minutes. As the data was also post-processed on site after the survey using the automated tools, just two to three hours were required to produce the final data, which the mine owners agreed was just as accurate as their conventional photogrammetric methods.
Effective new approach
The results of the Matterhorn project and the underground mine tests have proven that TLS is an effective new approach for analysing the stability of rock mass in several contexts, both with static and kinematic surveying. This helps in planning more detailed investigations, designing protection works and defining the most appropriate strategy to monitor slope deformation in the future.
Andrea Tamburini
Dr Andrea Tamburini is a geologist with a PhD in geomatics. He has led several projects regarding landslide and glacier hazard assessment and monitoring. From 1987 to 2007, Tamburini worked with various ENEL Group research companies (ISMES, CESI). Since 2007 he has been president and CEO of IMAGEO Srl, a spin-off company of Turin University. His main expertise regards the use of geomatics for the study and characterisation of unstable slopes at both local and regional scale, as well as the geomechanical characterisation of rock cliffs, open-pit mine slopes and tunnel faces.
Figure 1, South-west ridge of the Matterhorn as seen from the survey point (Carrel Hut visible in the centre).
Figure 2, Slope orientation analysis (left) and orientation of the main discontinuity sets (right) on the Matterhorn.
Figure 3, Automatically generated slope mass rating (SMR) map of a slope near Courmayeur in the north-western part of the Alps (red indicates areas that are less stable).
Figure 4, Tunnel face (left) and automatically generated map of its joint orientation (right).

Value staying current with geomatics?
Stay on the map with our expertly curated newsletters.
We provide educational insights, industry updates, and inspiring stories to help you learn, grow, and reach your full potential in your field. Don't miss out - subscribe today and ensure you're always informed, educated, and inspired.
Choose your newsletter(s)


