Innovative Ways to Monitor Land Displacement
When people think about landslides, they usually imagine large mud streams which cause considerable loss of life. Whereas such large-scale disasters are rare, smaller landslides are a much more frequent occurrence and pose a danger for traffic and housing in thousands of cities worldwide. In Italy, land displacement is monitored in innovative ways. Google News is used to calibrate the 24-hour prediction models, for example, and slope-instability risk maps are produced every six days based on Sentinel-1 radar images. In fact, Prof Nicola Casagli from Florence University has high hopes for a geostationary European InSAR satellite which will enable the daily production of a map for assessing ground displacements of 1mm.
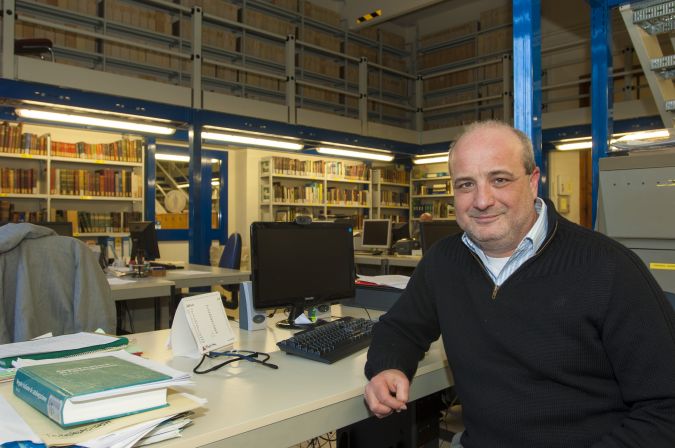
Can one predict with certainty where and when a landslide will occur? Prof Nicola Casagli, from Italy’s Florence University, has no doubt about the answer: “Landslides caused by earthquakes are impossible to predict, but all other types of landslides are predictable. You can forecast the time of failure even using simple models. You do need to have a continuous series of accurate monitoring data.” He adds, laughing: “But it is quite common to do the prediction after the event.” The art and science of predicting is never easy, but climate change is making things even more complicated nowadays. Casagli can handle it, though; his renowned Centre of Competence for geohydrological hazards is supported by 60 multi-disciplinary experts.
Flash floods
In the south of Europe, climate change is causing rising temperatures and a gradual reduction in the average yearly rainfall. Besides that, the precipitation increasingly occurs in more concentrated periods of heavy rainfall, triggering debris flows and shallow landslides – small, but very fast and dangerous. These landslides are increasingly being accompanied by flash floods: a large volume of water building up in one place in a very short space of time. This mixture of geological and hydrological phenomena is difficult to predict. Casagli: “You can monitor slow-moving, large landslides with satellites combined with ground based instrumentation for measurement of the exact displacements. Those are very easy to predict. For very fast landslides – debris flows, debris avalanches – triggered by intense rainfall, it is more difficult. The movement before failure is zero, but when heavy rain occurs they start to accelerate in seconds. The only way to predict them is to predict the rainfall.”
Besides the normal 24-hour weather forecast, data is also collected from rain gauges. These are in place throughout the whole country, with different defined thresholds per zone based on normal rainfall characteristics, bedrock lithology and landscape morphology. When a threshold is exceeded, the regional landslide early-warning system issues a moderate or high alert, spatially limited to the authorities of that zone. Of course, there must be certainty that those thresholds are correct so that no false alarms are raised or the alert fails to be issued when it should be. To ensure this, Casagli uses spatial data mining techniques. A semantic engine analyses Google News for reports of landslides that occurred in the previous week. By comparing the reported events with the rain-gauge data – all rainfall parameters (intensity, duration, amount, etc.) are stored in a database management system (DBMS) – the thresholds are kept up to date and the alerts provide trusted input for the landslide prediction model.
Two thousand landslides reported last year
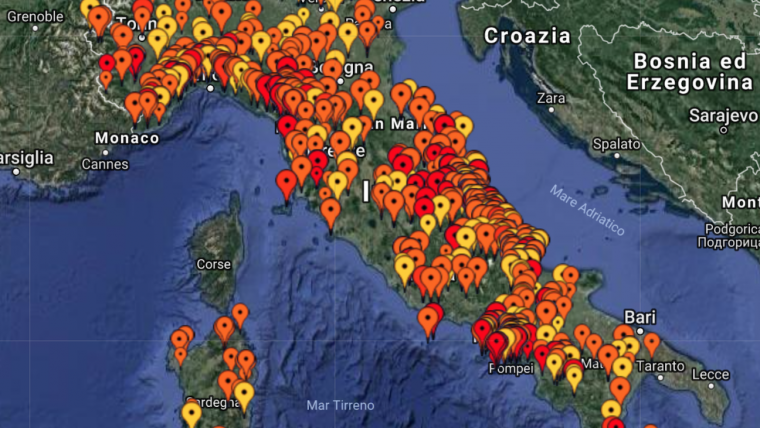
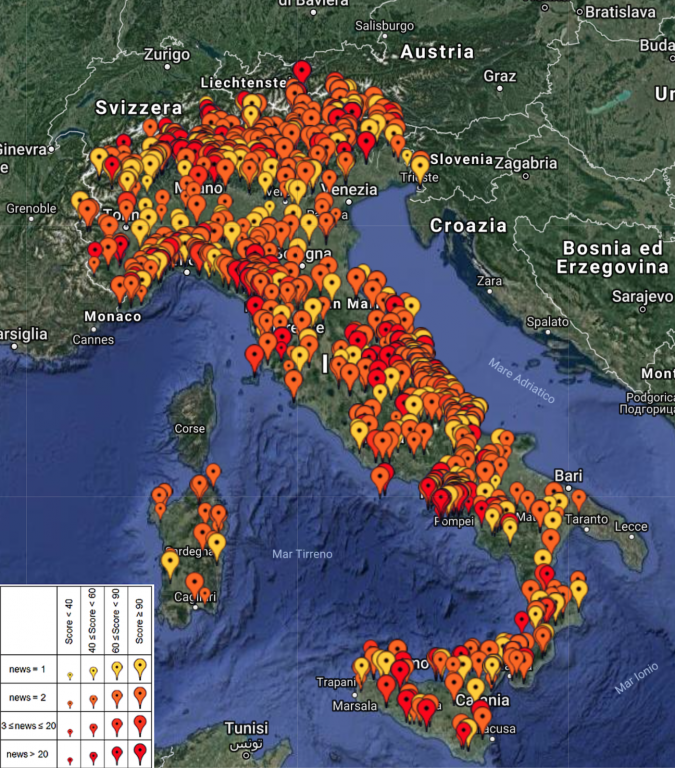
Casagli explains the importance of Google News. “To predict landslides caused by precipitation, you need information on landslides as well as weather predictions and data from rain gauges. If I predict a landslide will occur tomorrow based upon precipitation, I subsequently need to know whether a landslide did actually occur on that day. We match the data with rainfall data and refine the prediction. The more data we have on landslides, the better our predictions become.”
The semantic engine analyses all the news reports about landslides (and about the 34 synonyms for ‘landslide’ that exist in the Italian language) that really occurred. Last year there were more than 2,000 such news items. In fact, this manner of calibrating landslide prediction models is a digital follow-up. In the 1980s, scientists in Italy started to compile large databases of newspaper data on floods and landslides, until the government cut all funding in 2002. But since 2010 the scientists have been using spatial data mining techniques. The semantic engine now analyses all the news in Google News and in the database of ANSA, the national press agency. Many reports of minor landslides go to local or regional newspapers rather than to ANSA, but they are all on Google News, as are most of the digital-only local newspapers.
Warnings every 24 hours
To actually predict landslides, all the data is input into several models that are used simultaneously. Experts within the National Civil Protection service and in the regions evaluate the outcomes every day and make a decision. That is then translated into a map showing expected landslides and floods, which is made publicly available on the www.protezionecivile.gov.it website.
On a nice sunny day in February, almost the whole of Italy is shown in green on the map with yellow indicating a low probability of landslides or floods in just a few places. “The national warning system gives warnings every 24 hours. That is enough for most problems, but not for all. Sometimes we would need ‘now-casting’ of heavy rainfall (as opposed to the normal 24-hour ‘forecasting’, Ed.), but hourly prediction is still in the research phase; the degree of uncertainty is still to high.”
Uncertainty also plays a role at the local level. Casagli is a member of the National Risk Commission and sees the struggle the mayors face whenever the map turns red or orange in their territory, because this means the mayor has to take action as a local authority of civil protection. Every municipality has a civil-protection action plan and should know what to do in the case of each colour. “Here in Tuscany the colour red occurs two or three times per year. Then, schools are closed, some offices are closed, houses near rivers are evacuated and firefighters get ready. But orange is a problem; it’s the mayor’s responsibility to decide what to do. You might have 10-12 orange alerts per year, and if you evacuate nine times without anything happening… So many mayors of larger cities waited too long and they are being charged with manslaughter. But it is not easy. In many cities, urban planning was non-existent during the time Italy became a richer country and we built whatever we liked. For instance, many rivers were put away under concrete and are now causing serious problems when floods occur. In our research group we now want to add an expert on risk communication.”
Sentinel-1 for monitoring
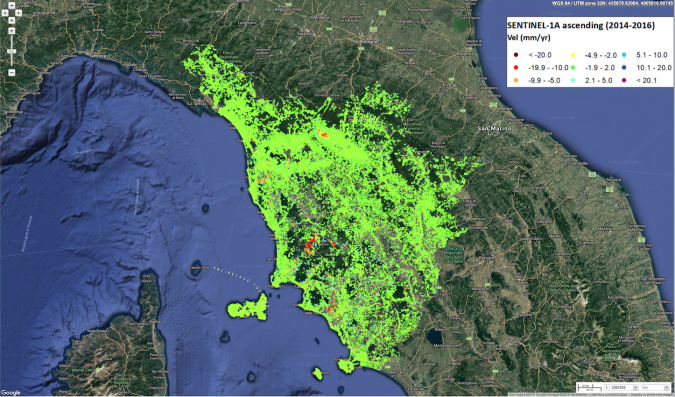
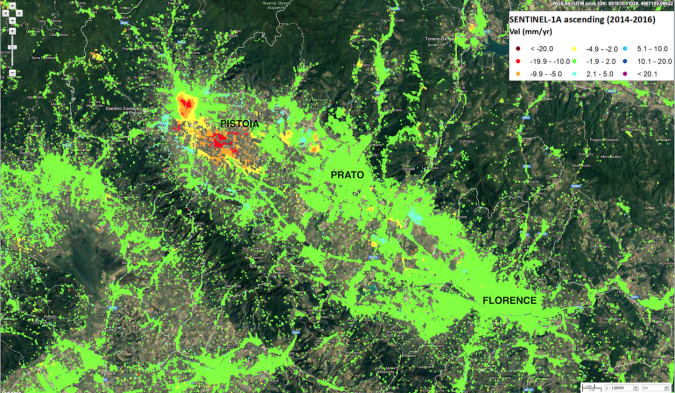
The Italian authorities are also provided, every six days, with scatter maps on the risk of slope instability, again based on applications developed and maintained by Casagli and his team. Sentinel-1 satellites belonging to the European Space Agency (ESA) have proved crucial. Casagli started using radar satellites to map and monitor landslides in the 1990s. With interferometry in all variations, the measurements of ground displacements over large areas can be extracted from the radar images. “Sentinel-1 is such a big step forward, it is like the change from a photograph to a movie.” With the previously available satellites, the revisiting time was at best 24 days. Now, Sentinel-1A and B revisit each part of the Earth every six days with the same line of sight – plus it is free. This opened up the possibility to use satellites for monitoring as well as mapping. Now, all the authorities can update their risk map with interferometric data. In Italy there are five levels of risk, from R0 (no risk) to R4 (extremely high risk). No building is permitted in the case of R3 or R4 codes. The district authorities decide on the exact boundaries. Changing a boundary or a level has a considerable effect on property value, so there is always great pressure from the owners. And of course, not all the authorities are happy to learn that they have to take action right away to solve a serious problem with a road or a building. But the satellite data provides quantitative information, and the pressure is reduced; it is not only based on an expert’s opinion. Casagli: “We are already doing completely new mapping every six days for two Italian regions. You can see on the scatter web maps which points are red, with significant ground displacements. Most of them correspond to R4 in urban areas.”
European stationary InSAR satellite
There still are limitations to the use of Sentinel-1. The main problem is the resolution of 14x5m. “That resolution is a problem when you want to build a warning system based on satellites only; you cannot detect all the relevant phenomena. We are now applying, with all the major radar-interferometry research institutions in Europe, for the third time to ESA for a geostationary radar satellite. Each day, one map image with an accuracy between 1 and 2mm will be composed out of all the interferograms. With one satellite it would be possible to map a circle with a 2,000km radius: more than half of Europe. We suggest a cooperation with ESA because they have good ground segmentation. By using that, we are certain to get an image of the same area every day. The application is ready. The satellite would cost €500 million. The same satellite can also be used for other applications such telecommunications and television. But in the European institutions, applications for smart cities, oceans, coastlines or desertification are more popular than natural hazards. It is a pity, because it is cheap and it can save lives. As a comparison: our four-satellite Italian system, COSMO-SkyMed, cost €800 million. The data is excellent (3x3m) but it is not free, and the standard revisiting time is 16 days.”
“Europe has been the leader in radar Earth observation since the 1990s; it had the vision to launch the satellites and to build an archive, which was crucial for new business to develop. But if ESA doesn’t take a step forward, Amazon or Tesla will take over its role and provide a new impulse. I would love to talk to Mr Musk. The information we would produce is crucial for traffic safety; if you drive in a self-driving car, you trust the authorities to keep the roads safe.”

Value staying current with geomatics?
Stay on the map with our expertly curated newsletters.
We provide educational insights, industry updates, and inspiring stories to help you learn, grow, and reach your full potential in your field. Don't miss out - subscribe today and ensure you're always informed, educated, and inspired.
Choose your newsletter(s)


