Lidar Quality Assurance
Open-source Software for Processing Lidar Point Clouds
Basic tools for processing Lidar point clouds, which can be extended depending on needs, provide a flexible platform for service providers and users alike. The companies Dielmo 3D, Spain, and Water Management, Australia, have demonstrated how a publicly available open-source application with basic tools for visualising, editing and analysing Lidar point clouds has been extended into a compliant platform that serves diverse applications including mapping of power-line corridors, land uses and riverbeds.
By José Carlos Garcia and Rafael Torró (Spain), and David Hine (Australia)
The platform, called DielmoOpenLiDAR and released under the GNU GPL licence, enables management and display of massive Lidar datasets together with vectors, rasters, OGC services such as WMS, WFS, WCS and other geoinformation. For professional users, the key benefits are the simplicity of implementing new algorithms to generate any output and the possibility to launch these algorithms easily in a tile structure, thus allowing processing on different computers to improve speed. The platform is based on open-source software, primarily gvSIG and SEXTANTE. Open source enables the use of many functionalities for free, which reduces development costs and time, and the extension of services without any licensing costs.
Quality Assurance
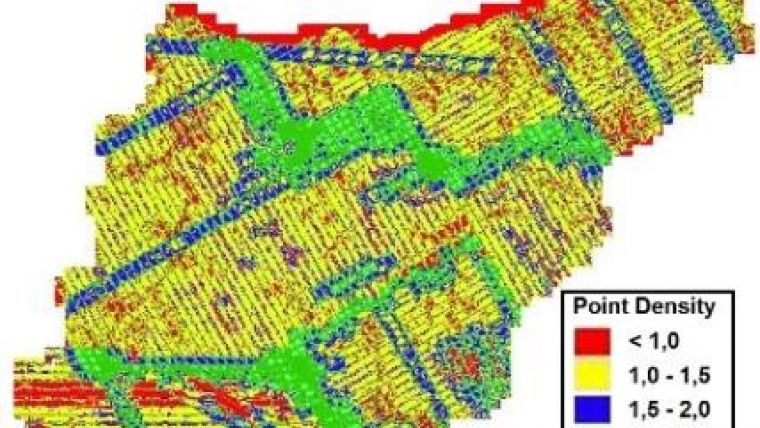
The core of the platform is the quality assurance (QA) part, which enables basic statistics to be derived from the headers of the LAS files, in particular the bounding boxes of the captured areas and tables (Table 1). Added to this, statistics are determined about the area captured by every flight line, including the shape of the area captured in a flight line together with a table (Table 2). The QA module also computes height accuracy using ground truth and the redundancy in the overlaps between flight lines. A check on completeness is performed by indicating regions with gaps, which usually correspond with water bodies but may also concern areas which have erroneously not been captured. Furthermore, the software outlines the point density of regions as intervals indicated by the user and thus also highlights the regions that do not comply with the point density requirements (Figure 1). A measure of matching errors is obtained from height differences of points in flat areas within overlaps.
|
File |
Density [points/m2] |
# points |
Area [m2] |
Z max [m] |
Z min [m] |
Version |
|
C:dielmo5366849.las |
0.3674 |
7,198 |
19,591.89 |
289.37 |
230.07 |
LAS10F0 |
|
C:dielmo5376847.las |
1.7393 |
11,586 |
6,661.29 |
353.02 |
325.72 |
LAS10F0 |
|
C:dielmo5376848.las |
0.039 |
34,075 |
873,705.47 |
360.8 |
97.23 |
LAS10F0 |
|
C:dielmo5376849.las |
0.26129 |
261,274 |
999,950.00 |
265.38 |
82.44 |
LAS10F0 |
|
C:dielmo5376850.las |
0.37609 |
131,508 |
349,672.,76 |
245.91 |
116.75 |
LAS10F0 |
Table 1, Example of a QA table containing the file path, approximate point density, total number of points,
area covered, height range and LAS format.
|
FLine |
# Points |
Area [m2] |
Density [points/m2] |
|
19 |
8,242,256 |
1,396,576.19 |
5.90176 |
|
17 |
840,891 |
161,861.65 |
5.19512 |
|
35 |
10,366,201 |
1,732,498.00 |
5.98338 |
|
36 |
283,127 |
72,400.00 |
3.91059 |
|
18 |
7,951,762 |
1,409,562.09 |
5.6413 |
|
33 |
9,321,257 |
1,414,111.28 |
6.5916 |
Table 2, Example of a QA table containing flight line number, total number of points,
area and mean point density of the overlaps.
In addition to QA, the platform enables a variety of parameters to be derived from the Lidar point cloud and these parameters to be compared against other (vector) geodatasets. The latter enables validation of the content of geodatasets and detection of changes over time.
Power-line Corridors
Corridors of power lines often follow strips where vegetation may grow quickly and become so tall that encroachment with cables and pylons may cause damage and dangerous situations. Mapping of such corridors is among one of the first-ever applications of airborne Lidar. To obtain reliable results quickly after flight, automation is key. A total of 35 steps enable vegetation risk analysis reports to be provided within three weeks and ground clearance reports within four weeks. 15 steps focus on QA, 10 steps are carried out fully automatically and 10 steps require manual editing.
Cables and pylons are manually digitised from maps and Lidar data and stored as vector layers and these represent the corrected network. Next over 40 types of classification – including buildings, roads, ground, towers, conductors at different voltages and crossing wires – are manually identified and outlined from the Lidar point cloud. After QA of the corrected network, it is used to cross-check the Lidar classification results. Next any vegetation which may interfere with cables and pylons is manually outlined. To ensure that the polygons do not contain errors, such as points in a pylon classified as vegetation, they are manually checked (Figure 2). Computation and QA is then repeated, resulting in a vegetation encroachment report. Finally, minimum distances to the ground, roads or to other conductors are determined for each conductor. The resulting report shows ground clearances of conductors based on weather conditions at the time of Lidar data capture.
Land Use
The Spanish Cadastre wanted to automatically detect land-use errors in its datasets. To support this aim, Dielmo developed the Catastro Lidar module. Based on vegetation parameters such as height and canopy coverage, different land uses including arable land, vineyards, olives, grapevines, citrus, riparian trees and meadows can be identified in Lidar point clouds based on a maximum likelihood classification. The type of land use is defined in the module but the user is free to add extensions. The module also allows detection of swimming pools, irrigation reservoirs and other constructions which are not represented in the cadastral data. Changes in building heights (Figure 3) and displacement of buildings can be identified as well as buildings present in the dataset but non-existent in the Lidar point cloud.
Riverbeds
A variety of parameters which can be derived from the Lidar heights can be used to improve hydrological datasets and to support flood modelling. Often the digital elevation models (DEMs) of riverbeds are coarse and inaccurate due to inaccessibility and dense vegetation. These DEMs are often densified by interpolation which may introduce artefacts. Dielmo has developed algorithms to improve the DEM in the riverbed. First, the DEM is created from the Lidar data followed by manually drawing the axis of the river and the outlines of the area. Next, profiles with an interval of one metre are extracted from the DEM and the lowest point is determined for each profile. Going downstream the heights of the profiles should decline, and profiles which do not obey this rule are eliminated. The others are used to correct the interpolation by integration with the Lidar data. This procedure can also be used to extend the Lidar DEM with bathymetric profiles measured with GNSS. Using these profiles as reference heights, the Lidar DEM can be completed.
Concluding Remarks
In consultation with foresters, the platform has been extended for estimation of silvicultural parameters such as height, canopy cover fraction, crown diameter and the vertical structure of the forest. The Java-executable code and user documentation can be downloaded. Service providers can customise the software for any client's needs while users can build new tools on top of the software themselves. Future developments will focus on bathymetric Lidar data. The challenge lies in the classification of the waterbed and the automatic discrimination between noise points and small rocks.
Biography of the Authors
José Carlos Garcia is founder and CEO of Dielmo 3D S.L., a firm founded in 2003. Prior to this he investigated methods to improve the quality and accuracy of DEMs in the LEO remote sensing group at the University of Valencia, Spain. Email: dielmo@dielmo.com
David Hine is CEO of Land and Water Management Pty Ltd, specialised in information management systems for agriculture and the integration of sensors into automated information systems. Email: David.Hine@landandwater.com.au
Rafa Torró holds a BSc in Geography and an MSc in GIS and Remote Sensing. He is international business developer at Dielmo 3D S.L. and has participated in research projects at Regional Cartographic Institutes in Spain. Email: rafa@dielmo.com

Value staying current with geomatics?
Stay on the map with our expertly curated newsletters.
We provide educational insights, industry updates, and inspiring stories to help you learn, grow, and reach your full potential in your field. Don't miss out - subscribe today and ensure you're always informed, educated, and inspired.
Choose your newsletter(s)


