Mapping a University Campus in Brazil
Creating Indoor and Outdoor Maps for a Routing Application
A pilot project conducted at a university campus in Curitiba, Brazil, aimed to create outdoor maps using UAS photogrammetry as well as indoor floor plans.
At universities, facility managers and other support staff need easy access to data, including geodata, for maintenance, safety measures or routing of students, staff and visitors. A responsive geodatabase containing detailed and up-to-date information on roads, the interior and exterior of buildings and other objects is a key tool in that context. The authors of this article describe a pilot project conducted at a university campus in Curitiba, Brazil, aimed at creating outdoor maps using unmanned aerial system (UAS) photogrammetry as well as indoor floor plans. They also demonstrate the possibilities of the database with a routing application.
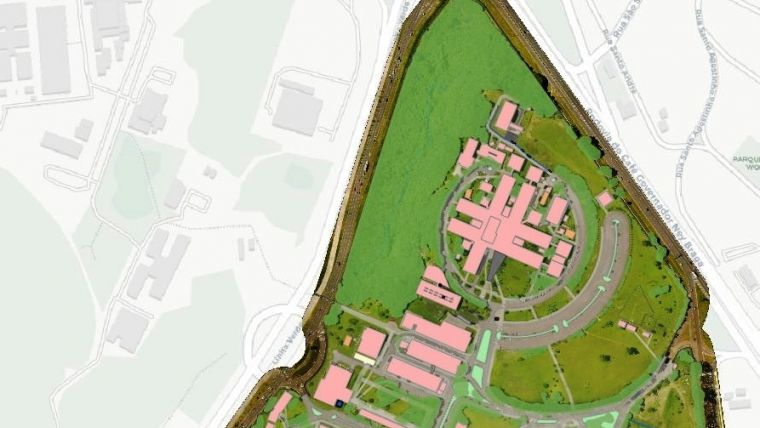
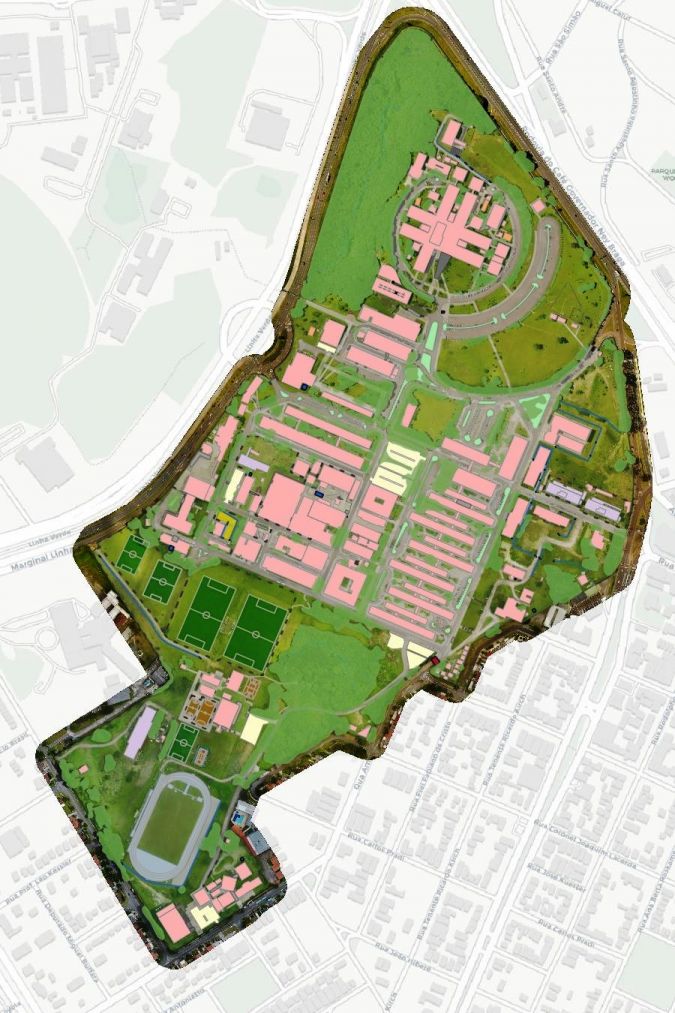
The Federal University of Paraná (UFPR) is headquartered in Curitiba, but it has a total of 26 campuses distributed throughout the entire state of Paraná in southern Brazil. Together the campuses comprise 1,100 hectares, of which 50 hectares are taken up by 316 buildings. In 2014, an ambitious pilot project called ‘UFPR CampusMap’ was launched, aimed at developing an enterprise GIS or ‘smart geodatabase’ for the university administration. To start with, an indoor and outdoor geodatabase of the Centro Politécnico campus in Curitiba was created (Figure 1). Within this pilot, the floor plans were obtained from facility managers, while the outdoor part of the database was created using UAS photogrammetry.
UAS Photogrammetry
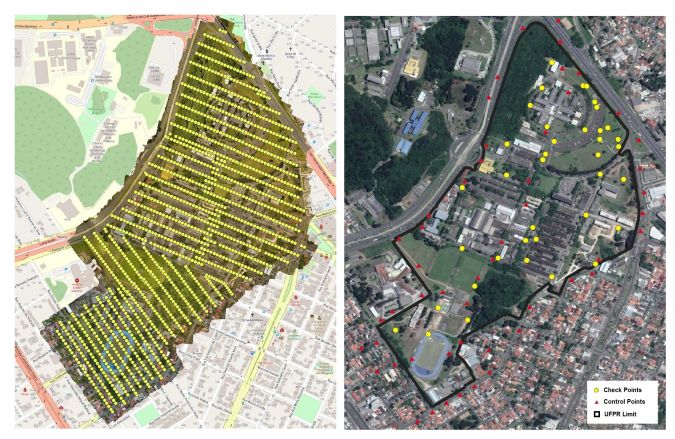
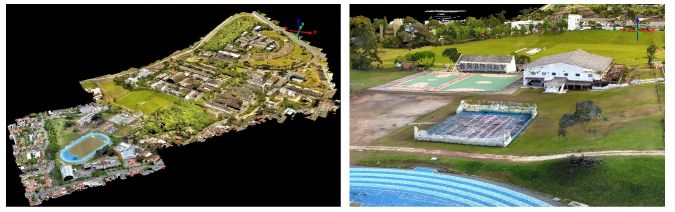
The base map was created from images captured with a Phantom 4 from DJI. For small areas, UAS photogrammetry is faster and cheaper than traditional photogrammetry. The campus was captured by 1,438 images with a ground sample distance (GSD) of 2.5cm and georeferenced using 50 control points measured with GNSS (Figure 2). Tie point extraction and bundle block adjustment with self-calibration was conducted using Agisoft Photoscan. The exterior orientation parameters and 3D object coordinates of the tie points were calculated simultaneously with focal length, principal point and lens distortion coefficients, i.e. the parameters of the interior orientation. Using dense image matching, 516 million points were generated with a point density of 600 points/m². A digital surface model (see Figure 3) and orthomosaics were generated from the point cloud and the images. Next, the outlines of buildings and other objects were manually extracted through stereo compilation according to the standards of the Brazilian Mapping Agency (Figure 4). The layers storing the different types of objects were edited in QGIS, the topology was built and a spatial database was created using Postgres/PostGIS.
The 3D coordinates of 35 check points, measured with GNSS, were compared against the 3D coordinates extracted directly from the digital surface model and through 3D viewing. The planimetric root mean square error (RMSE) was 4cm (1.6px) and the height RMSE was 1cm (0.4px). The 3D RMSE was 4cm (1.6px). These mapping accuracies are better than the requirements for 1:1,000 maps as defined by the Brazilian Mapping Accuracy Standards.
Indoors
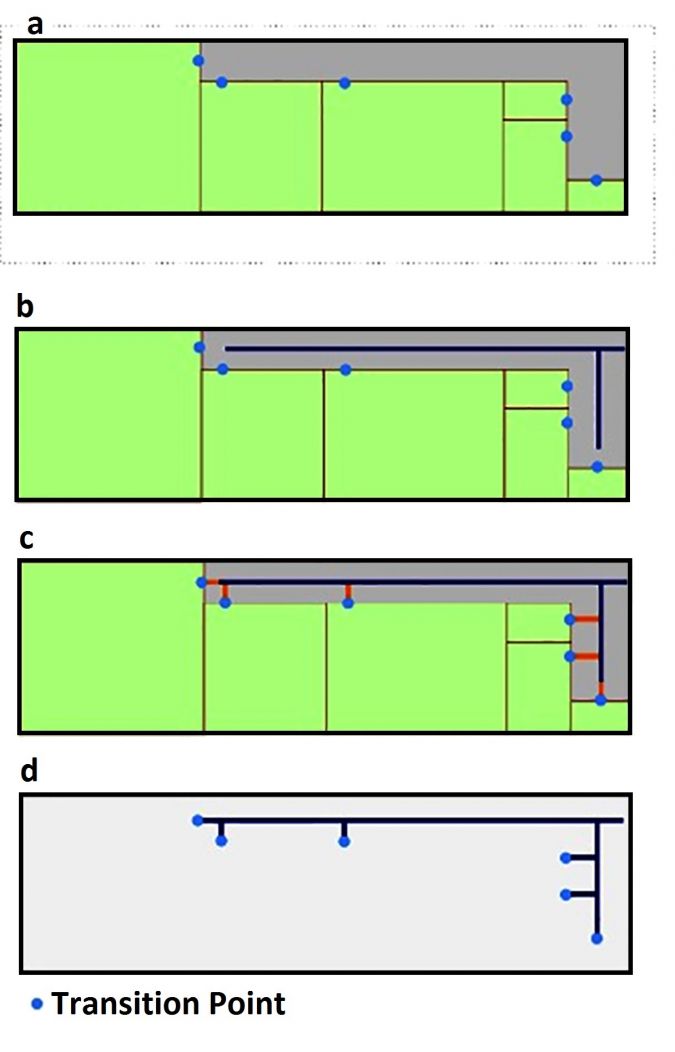
The 2D outlines of buildings, rooms, doors, exits, corridors, stairs and elevators for each floor were represented on maps (Figure 5a). Transition points were defined for routing purposes. These points are essential for finding the shortest path between two spaces using Dijkstra’s algorithm. Doors and corridors enable horizontal transportation between spaces on the same floor. Stairs and elevators enable transportation in the vertical direction. Exits enable transportation between indoor and outdoor spaces. In the case of doors, the transition point was manually placed in the middle of the threshold and for corridors it was placed at the intersection of the centre lines of two corridors. The transition points and their connections resulted in a skeleton map (Figure 5). The centre lines of the corridors were created manually (Figure 5b). Next, the link between the transition points and the central corridor were created using the PostGIS function ST-ShortestLine (Figure 5c).
Routing
To find the shortest route between two locations Dijkstra’s algorithm assigns costs to the length of trajectories. For this purpose, the skeleton map was transferred to a graph by first generating nodes at the ends of line segments using the PostGIS function topology.CreateTopology. Disconnected, adjacent line segments were automatically snapped by defining a tolerance of 10cm. Once connected, the line segments became the edges of the graph. The number of stories per building varies from two to five, and all floors have the same floor plan. Applying the topology.CreateTopology function without caution would have connected line segments of different floors. Therefore, subgraphs were created per floor, except for the ground floor where OpenStreetMap data was combined with the skeleton map. If the routing entailed multiple floors, the subgraphs were joined by creating edges linking the transition points with the start and end points of the subgraphs. Within the cost function the Euclidean distance between the two floors was taken. In practice this meant max. 2m, which is a small distance compared to the total length of the routing.
Looking ahead
This routing algorithm allows the determination of the shortest path between two indoor points or between indoor/outdoor points. The next step is to differentiate according to mode of transport, such as on foot, by bicycle or on a moped. Using QGIS, PostGIS and Python, the creation of the skeleton map will be able to be fully automated, including the determination of edges and nodes. Similar indoor/outdoor databases will be created for the other UFPR campuses and these databases, in turn, will form the core of an enterprise GIS.

Value staying current with geomatics?
Stay on the map with our expertly curated newsletters.
We provide educational insights, industry updates, and inspiring stories to help you learn, grow, and reach your full potential in your field. Don't miss out - subscribe today and ensure you're always informed, educated, and inspired.
Choose your newsletter(s)


