Mapping Urban Fringes
Object Based Image Analysis: a Promising Technique
What is the potential of object-based image analysis (OBIA) for creating land-cover maps from high-resolution satellite images of urban fringes, and can the accuracy of OBIA be compared to visual interpretation? The authors demonstrate that classification of objects rather than individual pixels provides a fast, efficient and simple semi-automatic method for generating land-cover maps. Overall accuracy is equivalent to visual interpretation.
Suburban fringe areas are characterised by intermingling of vegetation and structural elements. They are also subject to rapid changes in land-cover. Sustainable development of such heterogeneous, complex and dynamic landscapes requires constant monitoring based on proper decision making and up-to-date land-cover information. High-resolution satellite imagery can cost-effectively provide the latter for urban conglomerates.
Methodology
A multitude of methods exist for extracting information in the process from imagery to land-cover maps. Methods can be categorised under three major approaches: pixel-based classification, object-based image analysis (OBIA) and visual interpretation combined with manual digitization of object boundaries. Pixel-based classification assigns individual pixels to classes on the basis of spectral and textural similarities according to one of the many rules that have been evolved to govern multi-spectral decisions. Pixel-based methods often result in ‘speckled' land-cover maps. Object Based Image Analysis (OBIA) works by grouping individual pixels into objects before classification. Classes are then assigned to these objects based on decision rules similar to those applied for pixel-based classification. This is done through multi-scale classification of objects, OBIA enabling efficient incorporation of object characteristics such as texture, shape, context and hierarchical relationships in the classification process. Visual interpretation depends heavily upon human psyche and experience, lacks flexibility and reproducibility, and is time-consuming and thus costly. But this is usually the only option when mapping urban areas from high-resolution satellite imagery, because such scenes are characterised by high spatial variation and inter-class spectral similarity, and intra-class spectral heterogeneity. These properties make multi-spectral classification prone to error, forcing the analyst to rely on visual interpretation.
Area and Data
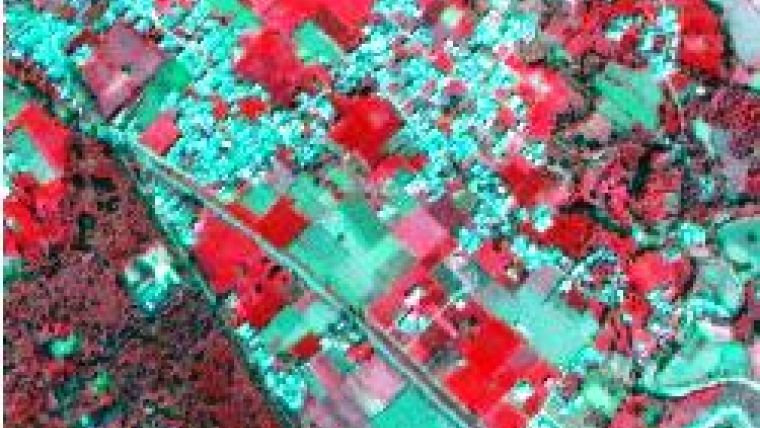
To study whether OBIA can replace visual interpretation in complex urban scenes, a test site was selected in the southern suburb of Dehradun City, Uttarakhand, India, a developing area with heterogeneous land cover. From co-registered Cartosat-1 and IRS-P6 LISS-IV imagery, fused by Gram-Schmidt spectral sharpening technique implemented in ENVI version 4.3, a 500 x 500 pixel scene was cut, with pixel size 2.5m (Figure 1). Traversed by a highway and rail route, the south-western area is institutional, with a complex mixture of open forest, underlying tea gardens and embedded buildings. The other parts of the scene are predominantly agricultural, interspersed with medium-density residential settlement, mainly along the roads. The eastern part is traversed by a dry riverbed flanked by a dense intermix of trees, cropped and non-cropped agricultural land, degraded land, orchards and unutilised vacant land.
Classification
A classification scheme was chosen which enabled us to test the ability of OBIA to deal with spectral overlap, so the number of classes is not high. A hierarchical land-cover classification was adopted consisting of three levels: buildings; built-up category consisting of transportation features including roads, lanes and railways; non-built-up category consisting of crop-growing land, vegetation (tree-covered land), vacant land and riverbed. Most challenging was vacant land. This category includes various subtypes of land cover: bare, open with wild vegetation, degraded, fallow agricultural fields and grassed patches. Accordingly, this class shows high spectral and spatial heterogeneities and is not well separable from riverbed and crop land, sharing many of their spectral features. Built-up areas with vegetation comprise a visually inseparable mix of constructions, vegetation and bare ground appearing in the image with high intra-class tonal and textural variability.
Segmentation
Multi-resolution segmentation, followed by iterative Nearest Neighbour (NN) classification was applied using eCognition Professional 4.0. The accuracy of OBIA is highly dependent on successful image segmentation. To cope with the large variation in object size, two object levels were selected (Figure 2): Level 1 for extracting small objects and Level 2 for large objects (Table 1). Higher weight was assigned to the infra-red band due to the predominance of cropped land and vegetation. Shape and smoothness parameters were set rather high to avoid frayed boundaries. Slightly over-segmented levels were selected to ensure improved classification accuracy. NN is a simple classifier that assigns class according to nearest matching of feature values of sample objects with feature values of the object. The feature values of class prototypes were determined from ground truth.
Classification is done at multi-scale and iteratively (Figure 3). The features of Level 1 comprised means and ratios of spectral bands, and shape and texture measures. The features of Level 2 comprised means, standard deviations and ratios of the multispectral bands and texture measures. After initial classification, adjacent objects assigned to the same class were merged into one object. The two levels were then projected into one layer (Figure 4).
Equally Accurate
To determine the accuracy, a confusion matrix was generated and from this were computed overall accuracy of 76% and kappa coefficient of agreement as 70%. Also computed were user's accuracy (UA), producer's accuracy (PA) and conditional kappa coefficients (CKC), see Table 2. Since transportation features were not extracted as distinct continuous linear units, they are merged with buildings into ‘built-up' for accuracy evaluation purposes only.
The various class accuracies shown in Table 2 demonstrate that at object Level 1, built-up could be well differentiated from non-built-up. Although accuracies differ class-wise, the overall accuracy of OBIA is equivalent to that obtained by visual interpretation. Only transport features could not be satisfactorily extracted, probably due to spectral similarity with objects alongside them, shadow occlusion and vegetation, and narrow roads and railways. Classes with distinct spatial, textural and spectral characteristics, such as built-up areas, vegetation (trees) and cropped land, could be effectively distinguished. Misclassifications are primarily associated with spatially and spectrally indistinct classes: vacant land and land-cover transition zones. High spectral overlap exists between vacant land covered with wild vegetation and cropped land, and between dry riverbed and bare ground. The fusion of images by the Gram Schmidt method introduced slight spatial degradations which may have contributed to misclassifications along boundaries. Subtle differences in tone and texture, visually indiscernible to the human eye, were successfully detected. For example, patches of vacant land amidst cropped, tree-covered areas and built-up structures were successfully identified on the basis of slight textural and spectral differences (see box A in Figure 4). When the spectral overlap between adjacent objects is high, their borders do not correspond to real-world shapes (see jagged boundary of transportation routes in box B of Figure 4).
Concluding Remarks
NN is a simple classification method and refinements in rule structure can greatly improve accuracy. The impediments caused by spatially indistinct and spectrally overlapping classes can be tackled by using auxiliary layers. Mixed classes can be more accurately identified by incorporating class-related features in the class description. Higher resolution images will probably lead to better results. OBIA appears well suited for various applications in urban fringe areas, such as determination of impervious surfaces and green spaces, study of urban sprawl, and land-cover change detection.
Acknowledgements
Thanks are due to Dean, IIRS, Ms. Poonam S. Tiwari, Ms. Heena Pandey and Ms. Meenakshi of IIRS.
Level | Scale | Shape | Smoothness | Description |
1 | 22 | 0.3 | 0.9 | Roads, Buildings |
2 | 38 | 0.3 | 0.9 | Vegetation, cropped fields, vacant land, river |
Table 1, Object levels, segmentation parameters and corresponding feature classes chosen for multi-resolution segmentation.
Class | UA | PA | CKC |
Built-Up | 91% | 71% | 0.89 |
Cropped land | 82% | 69% | 0.78 |
Vacant land | 62% | 68% | 0.49 |
Vegetation (trees) | 71% | 86% | 0.64 |
Built-up with vegetation | 71% | 100% | 0.69 |
River | 100% | 78% | 1 |
Table 2, Accuracy statistics for diverse classes.

Value staying current with geomatics?
Stay on the map with our expertly curated newsletters.
We provide educational insights, industry updates, and inspiring stories to help you learn, grow, and reach your full potential in your field. Don't miss out - subscribe today and ensure you're always informed, educated, and inspired.
Choose your newsletter(s)