Monitoring 3D Urban Growth: An Innovative Approach Integrating Lidar Processing with Machine Learning
Automated measurement of the third dimension of urban growth is a crucial requirement for future urban planning and monitoring. Airborne Lidar is increasingly being used to produce regular time-based data over metropolitan areas. However, the current solutions ignore the specific needs of urban planners, are complicated to run and fail to address the problem of monitoring 3D urban growth over time at building scale. To address the current challenges, two possible solutions have been developed into an integrated procedure, as outlined in this article.
Urban planners want to automatically estimate all three dimensions and model the changes to buildings, the building footprints and absolute height information over time to monitor growth and predict change patterns accurately. To monitor changes to buildings over time using airborne Lidar data, there are two possible solutions for processing the data, as listed below. This article investigates which of these two possible solutions is the preferred solution, and which is able to best determine the magnitude of change in the heights of the buildings.
- Solution 1: Classification of buildings using temporal Lidar datasets and the determination of the magnitude of changes by comparing the extracted building heights. For this solution, two approaches were tested: a pixel-based approach using a machine learning algorithm known as Support Vector Machines (SVM), and a point-based approach using a tool from ERDAS IMAGINE which is a software solution for processing data acquired by remote sensing and photogrammetry technologies.
- Solution 2: Application of a change detection algorithm to temporal Lidar datasets and the determination of whether or not changes have occurred in a building class. For this solution, two pixel-based algorithms were applied, namely SVM and image differencing.
Data processing
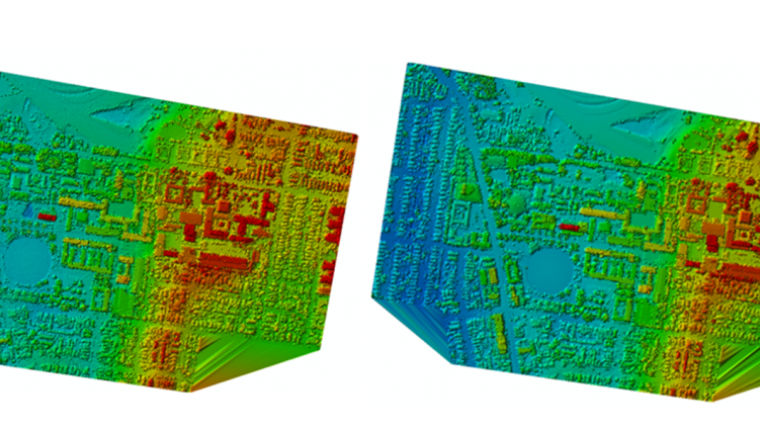
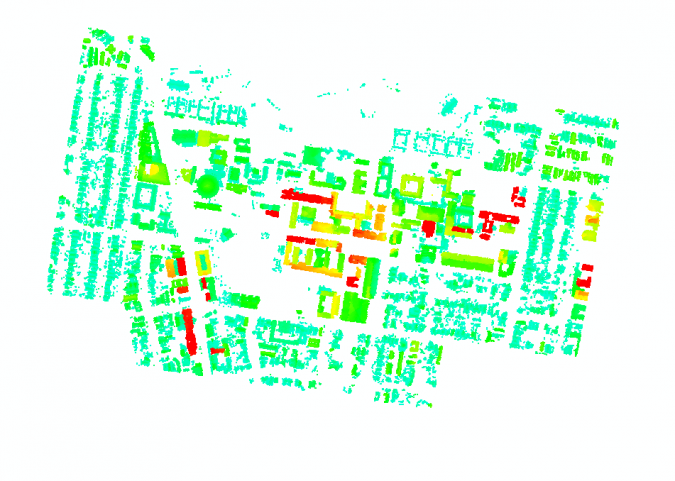
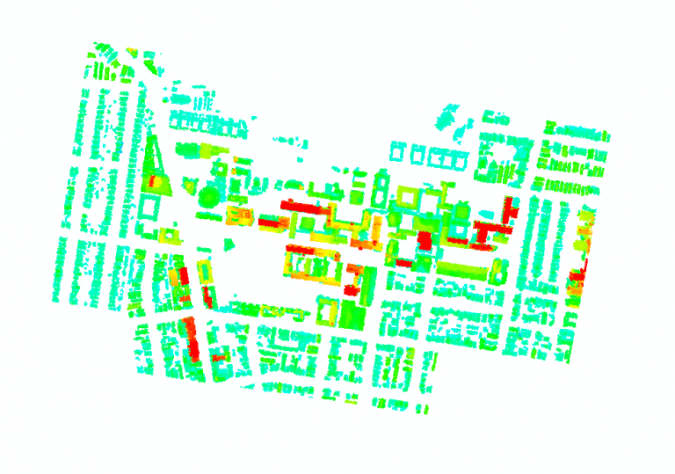
To investigate the solutions, bi-temporal airborne Lidar datasets are required as a minimum. In this research, the datasets used were collected in 2005 and 2008 above the University of New South Wales (UNSW) campus in Sydney, Australia. Lidar data is usually represented by points; however, it can also be converted to pixels containing XYZ information of the points within the pixels. The resultant raster data is called a digital surface model (DSM). The UNSW Lidar dataset DSM covers plain, sloping and complex urban scenes with various sizes of urban objects (Figure 1).
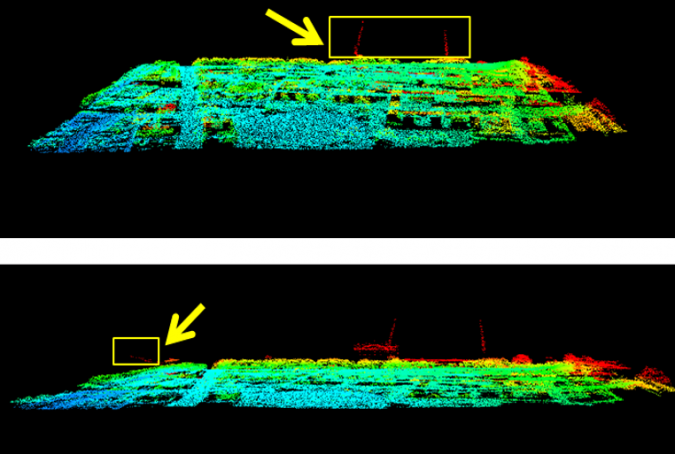
Before applying any algorithm, some pre-processing is required. Removing outliers from the datasets is a key preparatory task for both building classification (Solution 1) and change detection (Solution 2). In this case outliers can be generated by the measurement process (measurement noise) or constitute height points that do not contribute to the change detection process of urban buildings. Outliers observed in the 2008 dataset include construction machinery such as tower cranes (Figure 2).
For Solution 1 (building classification), SVM was applied to both the 2005 and 2008 datasets. In addition, the point-based classification tool in the ERDAS software was used. For Solution 2 (change detection), image differencing and SVM were used on the time-series pixels.
Results
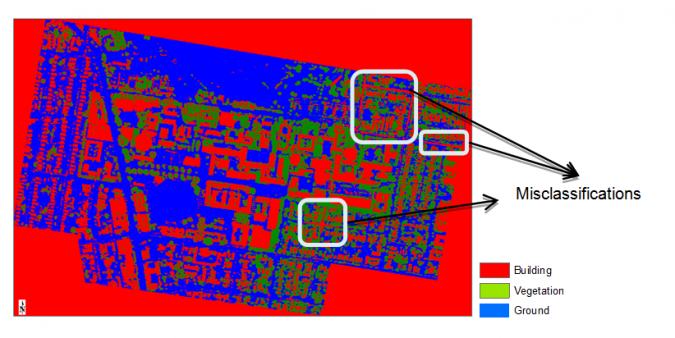
The research showed that Solution 1 using building classification of time-series Lidar data for monitoring 3D urban growth is time consuming, cumbersome, complex for non-experts and less accurate than using a change detection algorithm. As demonstrated in Figure 3, the building classification using SVM for 2005 data shows significant misclassifications between roads and buildings in sloping terrain, which is the result of classifying the boundaries of buildings as trees. This is in line with previous experimentation by the authors in the same area. This problem can probably be remedied by adding aerial image data and stacking the resulting RGB layers as additional layers for the SVM method. Since temporal aerial images were not available, further work on improving the SVM result using additional images was not possible.
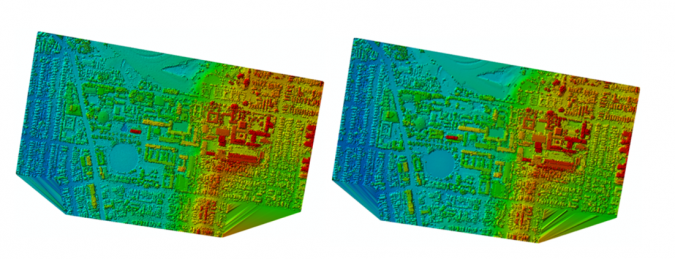
Next, the classification tool in ERDAS was tested for its suitability for the point-based approach for Solution 1 (building classification). The algorithm in ERDAS requires a number of parameters that have to be set interactively until the best result is obtained for the area under study (Table 1). With the chosen parameter thresholds, there was no problem of misclassification between roads and buildings in sloping terrain. However, visual comparison of classified buildings still showed some discrepancies among the results of unchanged building points (Figures 4 and 5). Another inconsistency can be seen in the level of omission errors in classified buildings of the two datasets, which is higher in the 2005 dataset than in the 2008 dataset. This inconsistency is an important issue for the determination of volumetric elements and pixel-based spatiotemporal building volume change calculations for an urban area over time.
|
Parameter |
Threshold |
|
Min. slope |
30° |
|
Plane offset |
1m |
|
Min. height |
0m |
|
Min. area |
100m2 |
|
Max. area |
10,000m2 |
|
Roughness |
0.3m |
Table 1: Parameters used in ERDAS.
Solution 2 (change detection) using image differencing is less complicated than the procedure described above. However, this method entails problems such as a high level of noise which causes a significant ‘salt and pepper effect’. For the SVM method applied for Solution 2, there is a lack of extraction of the magnitude of the height change. Other types of errors occur in building boundaries, and missing data causes errors that affect the results of DSM differencing.
Integrating the two methods
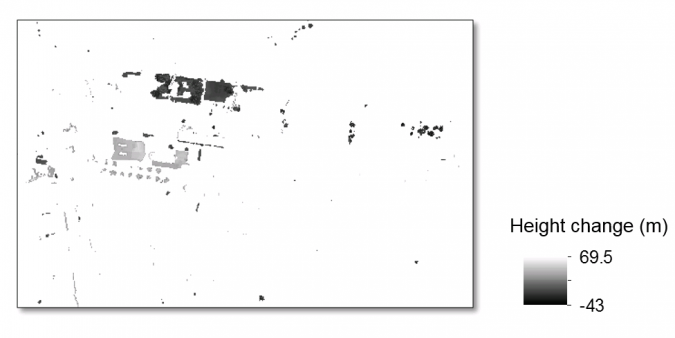
Considering the advantage of SVM giving a smaller salt and pepper effect and the benefit of the image differencing method for providing the magnitude of height change, integrating the two would address both issues, as demonstrated in Figure 6. For this solution, additional post-processing is recommended to determine to which specific class the detected changes belong: building, vegetation, road, etc. Depending on the aim of the research, it might be necessary to remove all unwanted items. For example, if 3D changes of buildings are important for sustainability studies, all other classes should be removed from the integrated result.
Conclusion
With the post-processed, integrated result, urban planners would be able to determine the changes in the magnitude of building heights rather than making an overall less accurate estimation achieved by using either of the conventional techniques separately. Accurate vertical changes enable policymakers to estimate ‘mass to voids’ and ‘buildings to green space’ ratios, which would consequently increase the application of airborne Lidar for the built environment.
References
- Shirowzhan, S., 2016, ‘Spatial and temporal pattern analysis of 3D urban development using airborne Lidar’, PhD thesis, University of New South Wales, Sydney, Australia.
- Shirowzhan, S. and Trinder, J., 2017. Building Classification from Lidar Data for Spatio-temporal Assessment of 3D Urban Developments. Procedia Engineering, DOI:10.1016/j.proeng.2017.04.308
- Trinder, J. C. and Salah, M., 2011. Support Vector Machines: Optimization and Validation for Land Cover Mapping Using Aerial Images and Lidar Data, Presented at 34th ISRSE Sydney, Australia, from 10-15 April 2011, http://www.isprs.org/proceedings/2011/ISRSE-34/211104015Final00895.pdf

Value staying current with geomatics?
Stay on the map with our expertly curated newsletters.
We provide educational insights, industry updates, and inspiring stories to help you learn, grow, and reach your full potential in your field. Don't miss out - subscribe today and ensure you're always informed, educated, and inspired.
Choose your newsletter(s)


