Pipeline Integrity Management from Space
Transmission Pipeline Monitoring Using Copernicus
Pipeline operators are responsible for the safe transport of oil and gas through high-pressure transmission pipelines. In the Western world, these transmission pipelines are buried in the public space at a depth of about 1.5 metres. Operators monitor the integrity of their pipelines on a regular or even continuous basis, as pipeline failures can cause severe damage to people, infrastructure and the natural and built environment. Read on for a discussion of the use of Copernicus Sentinel-1 satellite radar imagery to provide pipeline operators with a continuous source of information for monitoring and managing their assets from space.
(By Jan Ridder, Orbital Eye, The Netherlands)
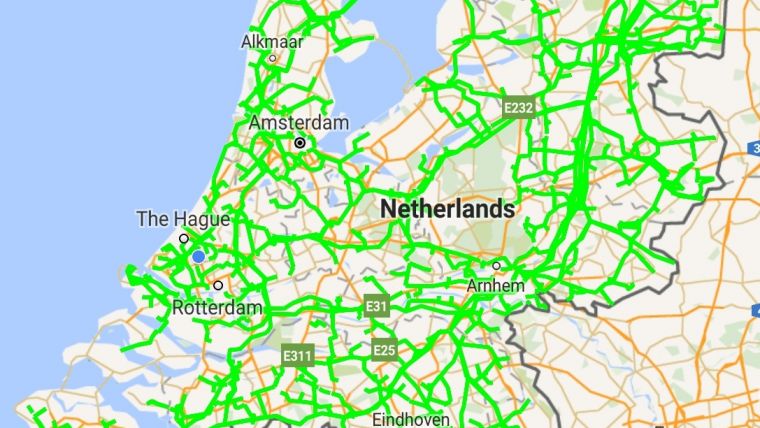
In a densely populated country such as The Netherlands, the total length of the public motorway network is about 2,700km while the total length of the high-pressure gas transmission pipelines belonging to the largest operator is roughly 12,000km (Figure 1). This means that, at least in The Netherlands, you are always many times closer to a buried high-pressure gas transmission pipeline than to a motorway. Failures in transmission pipelines are high-impact events with a large risk of severe damage. In Europe, the main causes of failures in high-pressure gas transmission pipelines are so-called third-party interferences (TPIs). Examples of TPIs are excavations, deep ploughing, construction activities and city encroachments. These TPIs are responsible for almost 50% of all failures in Europe.
Helicopter surveys
To minimise the threats caused by TPIs, as a mitigating measure pipeline companies survey their pipeline routes regularly using helicopters. Depending on the risk profile of the pipeline route, these surveys occur with a frequency of once per one to three weeks. Normally the helicopters fly at an altitude of 300ft and at a speed of approx. 200km/h. However, in a number of countries – especially in areas with a high risk of terrorism – the minimum allowed flying height for helicopters has recently been raised to 1,000ft as a result of anti-terrorism measures. This complicates close inspection in these areas. In general, helicopter surveys have a number of drawbacks, such as low visibility or no flight being possible at all due to bad weather conditions (rain, fog), safety concerns, noise, emissions and the relatively high costs associated with helicopter surveys in general. Pipeline operators therefore require other information sources that can reduce their need for helicopter surveys.
Copernicus
To detect threats to the integrity of transmission pipelines, a new method based on synthetic aperture radar (SAR) satellite data has been developed by Orbital Eye, a Dutch start-up in the space industry and alumnus of the ESA Business Incubation Centre in Noordwijk. The method – named PIMSyS – uses images that are acquired by Sentinel-1, one of the European Copernicus programme’s Earth observation (EO) satellites. The Sentinel-1 satellite was launched in April 2014 and mainly features a 12m-long C-band SAR instrument which operates day and night in all weather conditions. The satellite orbits the Earth at an altitude of 693km and has a repeat cycle of 12 days. Sentinel-1 is part of a constellation of two satellites, the second one of which is planned for launch later this year. Together they will revisit every place on Earth every six days.
Evidence-based inspection
The proposed satellite-based method is a cloud service to support pipeline operators with additional information about possible TPI threats to their pipeline infrastructure. The service facilitates evidence-based inspection: it supports the optimisation of the scheduling of inspections by providing information about the location of potential TPI threats so that real threats actually have a higher probability of being detected. Potential threats are identified through change detection based on amplitude and phase information in two radar images of the same area (that are acquired successively in time). The observed changes are then evaluated and filtered according to their probability of being a change in reality (in order to avoid a large number of false positives). The resulting change information can be complementary to other surveying methods or can partly – or even completely – replace current methods.
Processing chain
So far, a fully automated processing chain has been developed for Sentinel-1, TerraSAR-x and RadarSAT-2 images. The chain detects when new satellite images are available for areas with pipeline systems that are currently being monitored. The data is then automatically downloaded and processed. TPI threats are detected by comparing sets of two images for the same area. The time interval between two successive images depends on the satellite used. The intervals for Sentinel-1, TerraSAR-X and RadarSAT-2 are respectively 12, 11 and 24 days. The detected TPI threats that are not in the vicinity of the pipeline are filtered out to reduce data storage and transfer. All reports are sent via a secure internet connection to a client system located at the pipeline company. The client system consists of a spatial database, a mobile application (for tablets used by field operators) and a desktop application (for use at the office). The client system supports the display of maps, the location of pipelines, and display and interactive retrieval of detected TPIs, helicopter reports, vehicle reports and other observation reports. This information can be further combined with additional information about municipalities and landowners (where available).
Validation project
The satellite-based service was validated during an eight-month project executed together with a pipeline operator. During this project the identified threats were compared to the results of helicopter surveys. The validation project was executed in 2014–2015 in an area measuring 30km by 50km in the western part of The Netherlands. The original plan was to utilise Sentinel-1 data for this project. However, Sentinel-1 was not yet operational in this period so TerraSAR-X imagery was used instead. The total length of the pipeline route monitored during the project was approx. 238km, with a total pipeline length of approx. 366km (some routes contained more than one pipeline). For the eight-month period, six satellite images were available which were acquired at intervals varying from 22 to 66 days. For this time period, all reports of helicopter surveys (with a surveying frequency of once per three weeks) were also provided by the pipeline operator. In addition, a list was made available of all locations in the vicinity (within 50m) of the pipeline route where third-party excavation activities were planned. The pipeline company selected four locations in the project area where its own activities were planned during the validation project. For these four locations, the detected changes showed a perfect match with the actual start and end dates of the activities. However, these locations together represented no more than approx. 1km to 2km of the total pipeline route. For that reason, a statistical analysis was made for the entire validation period and for the total project area. This analysis proved a strong correlation of the results with other activities executed by the pipeline company for extension and maintenance of the pipeline system.
Correlation
For approximately 90km of pipeline route, the correlation was investigated between detected TPI threats and the results of the helicopter surveys and planned third-party excavation activities. In The Netherlands, planned excavations are registered through a central system known as KLIC. During the validation project, the helicopter and satellite-based method detected events at 152 unique locations. For 80 of those 152 locations (53%) there was information available via a helicopter report and for 134 of the 152 locations (88%) information was available via the PIMSyS satellite-based method. Table 1 shows the number of locations for which a certain combination of data sources was available. For example, only 4.6% of the 152 unique locations were covered by all available information sources. In 7.2% of the number of locations, a helicopter report matched with a KLIC registration (the sum of the number of locations in rows ‘Helicopter + Satellites + KLIC’ and ‘Helicopter + KLIC’ in Table 1). Similarly, the correlation between KLIC and the satellite-based method was 23.7%. One of the reasons for the relatively low correlation is that most third-party excavation registrations are active for only a short period of time (a few days up to two weeks) while the surveying frequency is once per three weeks for helicopters and 22-66 days for the radar satellites.
|
TPI detected by |
Helicopter |
PIMSyS satellite-based method |
||
|
Number of locations |
Percentage of locations |
Number of locations |
Percentage of locations |
|
|
Helicopter + Satellites + KLIC |
7 |
4.6% |
7 |
4.6% |
|
Helicopter + Satellites |
55 |
36.2% |
55 |
36.2% |
|
Helicopter + KLIC |
4 |
2.6% |
|
|
|
Satellites + KLIC |
|
|
29 |
19.1% |
|
Helicopter |
14 |
9.2% |
|
|
|
Satellites |
|
|
43 |
28.3% |
|
Total |
80 |
52.6% |
134 |
88.2% |
Table 1, Number and percentage of detected TPI threats based on the various combinations of available information sources, which shows the correlation between different TPI detection methods.
Further interpretation
There are 14 helicopter reports for locations that were not detected by the radar satellites. Analysis of these 14 reports showed that 10 reports were related to short-lived events that most likely both started and ended in the period between two satellite images. In addition, two helicopter reports showed no activity (false alarms) and two reports showed longer-lived activities that were not detected with satellite imagery. Of the 43 locations that were only reported by the satellite-based method, 33 were related to a major pipeline extension activity executed by the pipeline company. The helicopter did not report these events, even though the helicopter observer is instructed to report all activities including the activities of the pipeline company itself. In conclusion, the correlation between KLIC and PIMSyS was roughly three times higher than for helicopter reports. Furthermore, 88% of all locations were detected in total. This shows that the satellite-based TPI detection method is more reliable and provides pipeline operators with a valuable source of additional information for monitoring and managing their pipelines.
The author
Jan Ridder holds a university degree in applied physics. He has worked in various positions in R&D organisations in The Netherlands, both as a researcher and as a manager. Before joining Orbital Eye he was the director of an international technical service company. He has been managing director of Orbital Eye, a company specialised in pipeline safety management using satellite data, since 2012.

Value staying current with geomatics?
Stay on the map with our expertly curated newsletters.
We provide educational insights, industry updates, and inspiring stories to help you learn, grow, and reach your full potential in your field. Don't miss out - subscribe today and ensure you're always informed, educated, and inspired.
Choose your newsletter(s)


