Point Clouds (1)
The Functionalities of Processing Software
Whether based on Lidar, photogrammetry, radar, sonar or other remote sensors, systems for geodata acquisition create millions or even billions of 3D points. To be useful, the data needs to be organised, combined, georeferenced, measured and analysed, and that in turn requires software. This article first defines what point clouds are and identifies their sources. It then goes on to examine software functionalities such as visualisation and editing. The July 2014 edition of GIM International will be a themed issue covering collection and processing of point clouds and hence will include a selection of the many software packages currently available.
A point cloud is a set of data points represented in a preferred coordinate system. The dataset consists of measurements taken at discrete points of a curved 2D surface in 3D space. This 2D surface may be smooth or it may contain discontinuities such as facades of building. The number and density of the points should be such that the 2D surface can be reconstructed, i.e. at every point on the surface a value can be calculated from the measured values in the vicinity. This process is called ‘interpolation’. The initial data is unorganised; processing software is needed to organise the unorganised into a point cloud and extract information from it.
Point Clouds
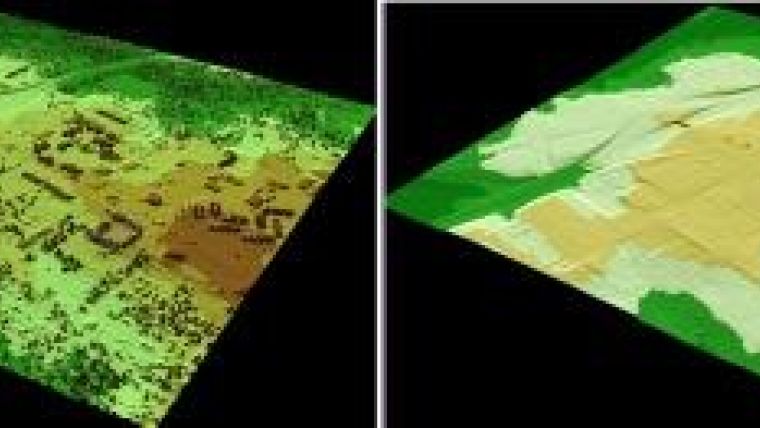
In principle, the curved 2D surface can represent any instance such as soil pollution, forest biomass, rainfall, terrain elevation or the seabed. In the field of geomatics, the phenomenon will usually be the terrain surface or the seabed in the form of a digital elevation model/digital surface model (DEM/DSM). The tools used to acquire the point cloud can include: levelling; GNSS; terrestrial laser scanning (TLS); airborne Lidar; airborne or spaceborne radar; terrestrial, aerial or spaceborne photogrammetry; or multibeam sonar. Another source can be contour lines digitised from maps. This article focuses on point clouds from which DEMs or DSMs can be created and products can subsequently be derived (Figure 1). These products can then be used in a variety of applications. For forest inventory, for example, the height of individual trees, the density of the canopy, biomass and the stand volume can be calculated, while in road construction volumes and masses can be calculated from a DEM to support earthworks. By comparing time series of DEMs, ore extraction of an open-pit mine can be determined as well as erosion and accumulation of sand in dunes to support flood risk management. The point cloud data consists of a set of x,y coordinates to which height/depth values have been assigned: one value per x,y location. Added to height or depth, other attributes may be attached to the x,y component, such as reflection intensities of the laser/sonar pulse or RGB of a colour image recorded by a camera at the same time (Figure 2). Hence, the x,y component and its attributes forms the nucleus of the point cloud and the number of nuclei may run into billions.
Sources
The vast majority of point clouds stem from the output of active systems, including airborne Lidar, TLS, radar or sonar, with the latter mainly being used for mapping seabeds and riverbeds. Thanks to advances in the underlying technologies over the past two decades, it is now easy to produce high-resolution terrain data at very high rates. For seabed mapping, for example, the shift from singlebeam to multibeam echosounders has increased the amount of data that can be acquired to billions of echo returns per day. Returns from Lidar and sonar are first stored in the form of range, angle and time. These are then integrated with 3D location data (latitude, longitude and altitude) collected by on-board GNSS and pose data (roll, pitch and heading) measured by an IMU, which is usually integrated with the GNSS, and if applicable compasses, barometers and odometers. The integration of the raw data is largely automated and results in a georeferenced 3D point cloud which often needs editing to remove outliers and other improper points. Usually the point cloud is transferred to a 2.5D surface in the form of regular grids or triangulated irregular networks (TIN). These products often act as the basis for input in CAD, BIM and other tools for the creation of a variety of products, such as contours, nautical charts, volumes or 3D landscape models. Added to this, the output should be in a format which is readable by CAD, hydrological and other application-oriented software. Point clouds may also stem from overlapping imagery, captured by nadir-looking or oblique cameras, using photogrammetric image-matching software. The cameras may be mounted in manned or unmanned airborne systems. Lidar point clouds are captured either in the air or from ground stations whereas radar sensors are either mounted on aircraft or are orbiting.
Continue reading in the online edition of GIM International.

Value staying current with geomatics?
Stay on the map with our expertly curated newsletters.
We provide educational insights, industry updates, and inspiring stories to help you learn, grow, and reach your full potential in your field. Don't miss out - subscribe today and ensure you're always informed, educated, and inspired.
Choose your newsletter(s)


