Underground 3D Scanning in Bhutan
Cavity Mapping above Collapsed Tunnel
A laser scanner was deployed when a tunnel roof collapsed at a hydroelectric dam construction site in Bhutan.
Surveying cavities in underground excavation projects can be difficult and dangerous. The collapse of a roof inside the main access tunnel at a hydroelectric dam construction site in Bhutan resulted in loss of life and a significant delay in progress. Project participants could not move forward with the tunnel work until they could ascertain the size and condition of the cavity that remained above the caved-in debris blocking the chamber. This article describes how an Indian technology application company deployed a laser scanner specially designed for cavity measurement to accurately determine the volume and dimension of the inaccessible space.
In 2008, the governments of Bhutan and India committed to working jointly on the development of a multi-billion-dollar hydroelectric project in Bhutan’s Punatsangchhu region, along the river of the same name. With an original completion date of 2020, the entire endeavour would generate 10,000MW of power and supply electricity to millions of homes in Bhutan and India.
The two governments set up the PHPA, an autonomous body involving organisations from both countries, to work on the massive undertaking. The centrepiece of the second phase of the project (called Punatsangchhu-II or ‘PHPA-II’) would be a dam of 86 metres high and 213.5 metres wide at the top. A series of tunnels, desilting chambers, surge and pressure shafts and an underground power station would be constructed, extending several kilometres from the dam site.
A Deadly Collapse
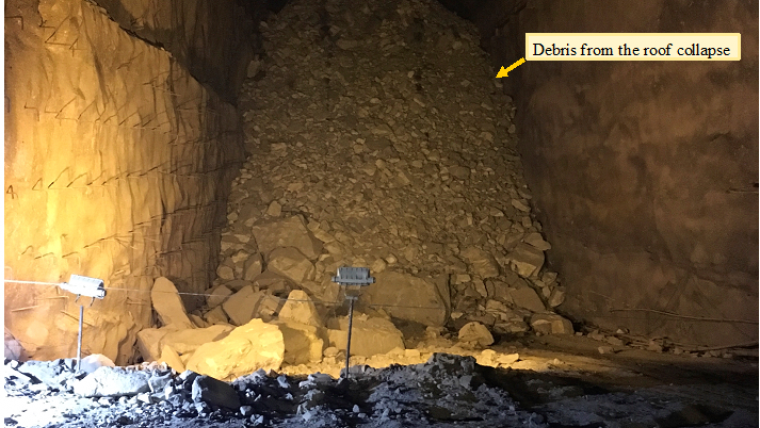
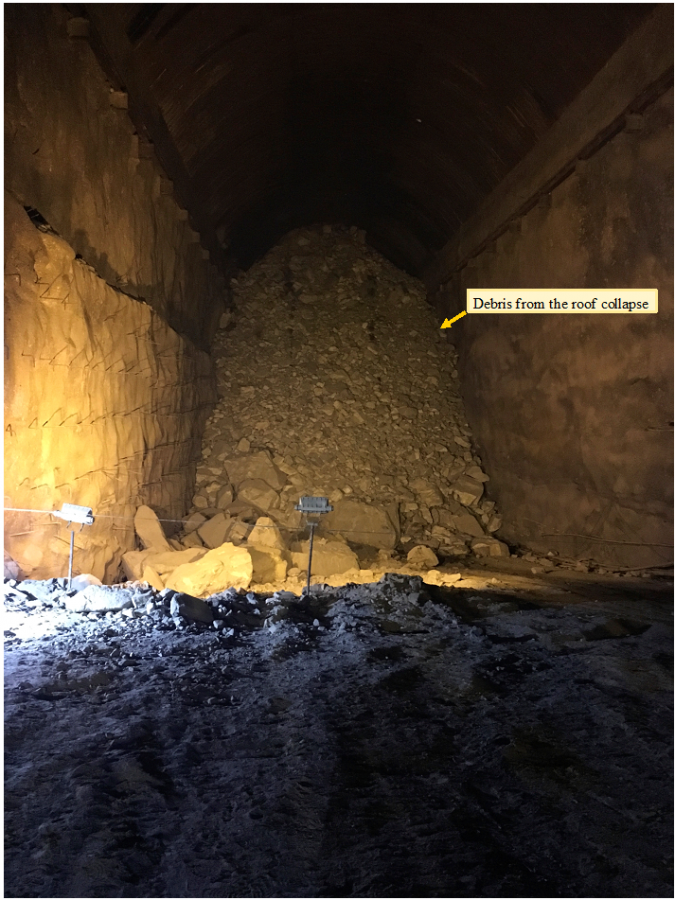
Excavation of a downstream surge chamber in the power station complex encountered a subterranean shear zone which resulted in a roof collapse in the main tunnel, leaving it completely blocked. This delayed the project for 1.5 years while PHPA evaluated the risk and determined how to proceed. The unplanned postponement created cost overruns and disruption to the proposed start of power delivery to customers.
The problem was a lack of information about the cavity formed by the collapse of debris down into the tunnel. Before proceeding with excavation of the rubble, PHPA wanted to survey the precise location of the cavity, measure its height, width and length, and determine the overall volume of the space. In addition, project engineers hoped to gain details of the structural stability of the void area. This information would assist PHPA in evaluating the risk of digging into the soil and rock blocking the tunnel. Having already experienced loss of life in the workforce, participants feared an additional cave-in and landslide would occur if the situation was approached incorrectly.
Identified Challenges
PHPA retained the services of Ansari Precision Instruments Private Limited (APIPL), part of the ROTER Group of Companies, established since 1936 in India. With a core focus on the surveying of land, mines and irrigation networks, APIPL is known for its expertise in utilising the latest in high-tech surveying and mapping products. The company evaluated the options for surveying the interior of the deep, inaccessible cavern.
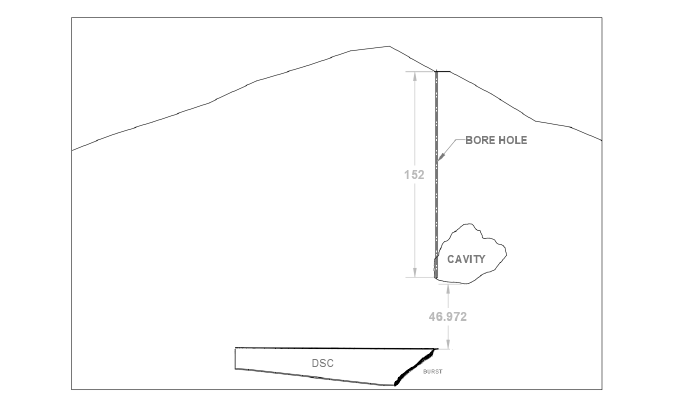
A nearly vertical 150m-long borehole with a diameter of 205mm (the widest diameter possible with the boring equipment available to PHPA) had been drilled from the exterior down into the cavity, providing some insight for PHPA. Several challenges were identified:
- The cavity was too deep to use ground penetrating radar.
- The borehole was too narrow for common laser scanners or cameras to be lowered into the space.
- The bore had not been drilled perfectly straight, making insertion of any device difficult.
- There was evidence that the interior of the bore was unconsolidated, greatly increasing the chance an instrument could become trapped once lowered into place.
Devising a 3D Modelling Plan
APIPL recognised that one viable solution for accurately surveying the space was to use the cavity monitoring system (CMS) developed by Teledyne Optech specifically to scan the interiors of underground areas too dangerous or difficult for personnel to reach. The laser scanner, which includes a built-in camera and integrated three-axis inclinometer, quickly collects thousands of points inside mines, caverns and other subterranean features to generate georeferenced 3D models and calculate their size, orientation and volume.
Fortuitously, an upgrade of the CMS instrument, the V500, had just been introduced at the time of this project with a slimmer profile (130mm) which would fit easily inside the 205mm borehole. But despite the suitability of the cavity scanner, challenges remained. Uncertainty related to possible curves in the bore, and the unconsolidated nature of its interior walls, led APIPL to determine the existing hole was too risky. A second borehole was drilled vertically into the chamber below, taking great care to keep the drilling straight. As an added precaution, the interior of the hole was lined with steel casing. These conditions would contribute to the safe insertion and extraction of the CMS V500.
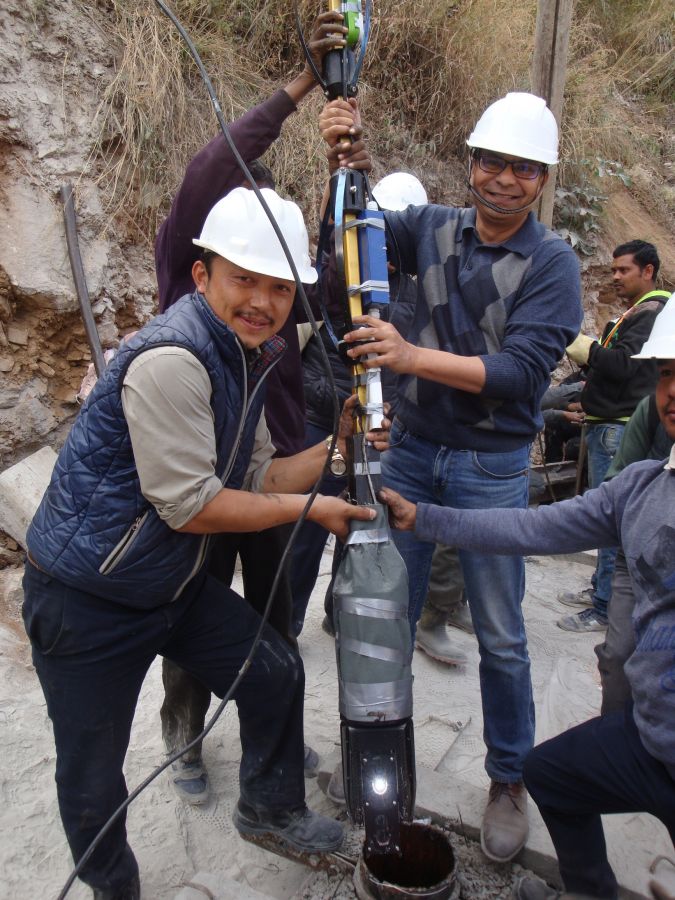
Preparing the CMS V500 Scanner
The surveying engineers devised a plan for deploying the scanner in a way that would capture the desired data from the cavity while also ensuring the instrument would not be lost. The first concern was the depth of the target area. At 150 metres, it was likely too deep for the device to wirelessly transmit the scan data and video data to the surface via Wi-Fi. Real-time wireless data transmission is an important capability of the CMS because wires and cables must be kept to a minimum when operating in subterranean environments, where a snag can potentially result in the loss of an instrument. While the engineers did not want to risk losing the device, nor did they want to take chances that data might be lost if the Wi-Fi failed to operate at such a depth.
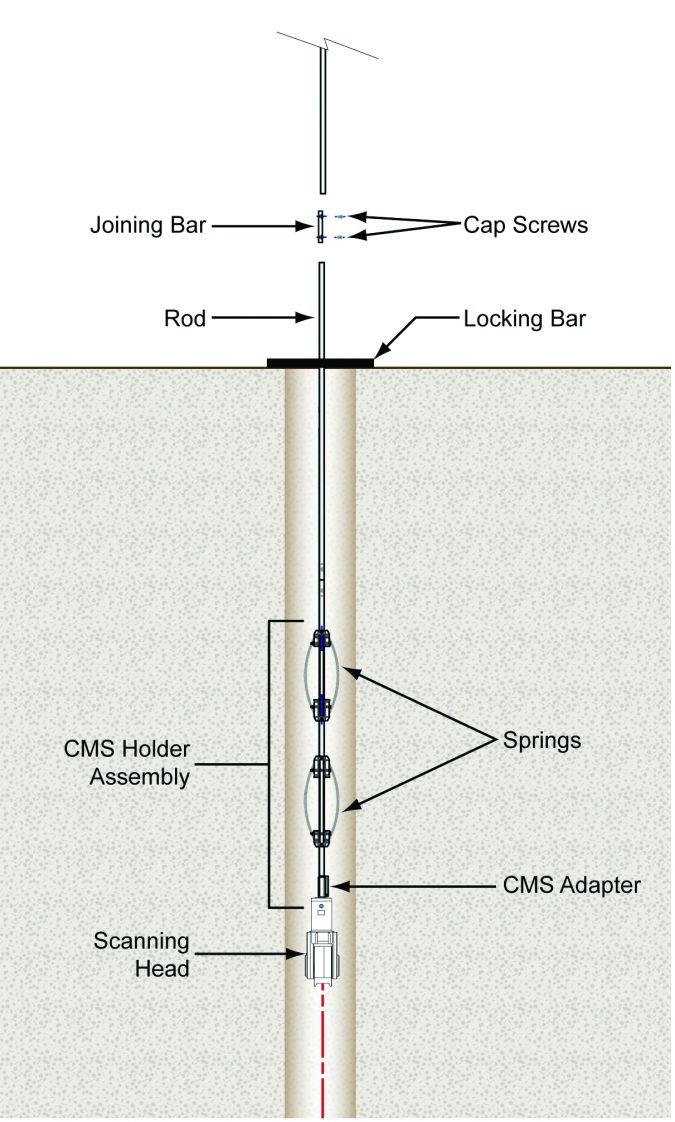
The decision was made to set up a custom fibre-optic cable from the instrument to a tablet computer on the surface. Not only would the laser scan data be captured and monitored in real time, but live imagery from the camera would also assist the operator in proper insertion. As an added safeguard, the surveyors opted to use a vertical insertion package (VIP) offered with the CMS by Optech. The VIP’s leaf-spring mechanism would keep the device steady and centred in the casing as it was lowered safely into the borehole.
Capturing Survey Data
In preparation for the cavity scan, the surveyors first used the CMS in terrestrial mode mounted on a tripod inside the tunnel. They collected five scans of the tunnel starting at the point where the cave-in occurred and then moving outward to the entrance: a total of 773.6199 metres. This information would be vital for representing the cavity in the correct orientation and location relative to the entire underground tunnel complex. At the location of the debris pile, the tunnel was 31.194m high and 18m wide.
The survey team used a total station to measure ground control points both outside and inside the tunnel to tie the captured 3D scan data into the project coordinate system. They also surveyed the surface location of the borehole. Engineers used this planning data to create a 3D model of the tunnel for incorporation into an existing terrain model of the entire site.
Scanning the Cavity
Prior to CMS insertion, a stand-alone inclinometer was attached to the VIP, which was lowered into the borehole by a winch on the surface over the opening. The inclinometer captured precise orientation and location data as it descended into the borehole before reaching the cavity at a depth of 152m. This test data would be cross-referenced later with the CMS scans and integrated inclinometer data to ensure the positional accuracy.
Next, the system was attached to the VIP for the all-important scan collection. As the apparatus was lowered by winch, the camera-equipped CMS captured images and low-resolution scans inside the borehole, which were transmitted in real time via the fibre-optic cable to the surface.
Crew members examined the imagery on a tablet as they slowly guided the device downward one metre at a time. A time stamp was made at each metre mark so the CMS scan data could be correlated with the recordings of inclinometer positional data.
Once inside the cavern at 152m deep, the CMS was switched to ‘fine scanning’ mode in which it acquired thousands of laser measurements. Each scan captured a point cloud with a 360 x 320-degree field of view in the void space. The inclinometer tracked the position of the scanner during each scan, and a total station mounted above the borehole surveyed the location of the VIP as the CMS was lowered.
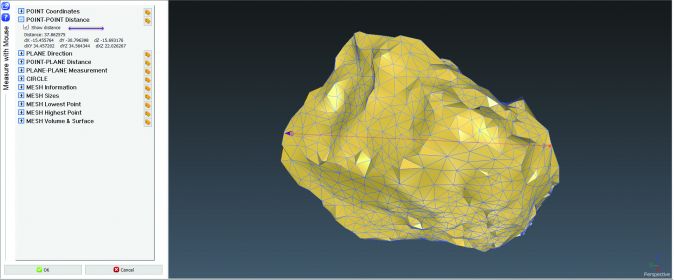
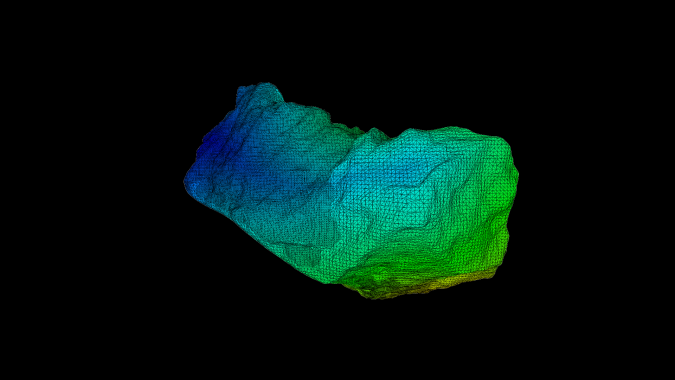
Creating a 3D Model
After safe extraction of the devices, Optech CMS Desktop processing software was used to remove noise from the scan data before merging the scans into a 3D point cloud representing the entire cavity. Data from the inclinometer and total station was used to register the scans to each other and then georeference the point cloud to the coordinate system of the project site.
As expected, the point cloud revealed a large cavity with undulating walls and an undefined shape. The CMS took thousands of measurements inside the cavity and the software determined its overall volume. The coordinate data precisely located the void space in the existing 3D model of the project site. This information gave the engineers a better understanding of the conditions in the area where the collapse had occurred and enabled them to begin formulating a plan to resume excavation in the main tunnel.

Value staying current with geomatics?
Stay on the map with our expertly curated newsletters.
We provide educational insights, industry updates, and inspiring stories to help you learn, grow, and reach your full potential in your field. Don't miss out - subscribe today and ensure you're always informed, educated, and inspired.
Choose your newsletter(s)


