Updating the Cadastre in Ecuador
Using Photogrammetry and Lidar Data
Photogrammetry and Lidar were used together in Ecuador to detect irrigation and drainage canals for a project aiming to improve irrigation methods and create the related land registry.
The integration of photogrammetry and Lidar can generate synergies and economic savings. The two techniques were used together to detect irrigation and drainage canals for a project aiming to improve irrigation methods and create the related land registry in the province of El Oro in Ecuador.
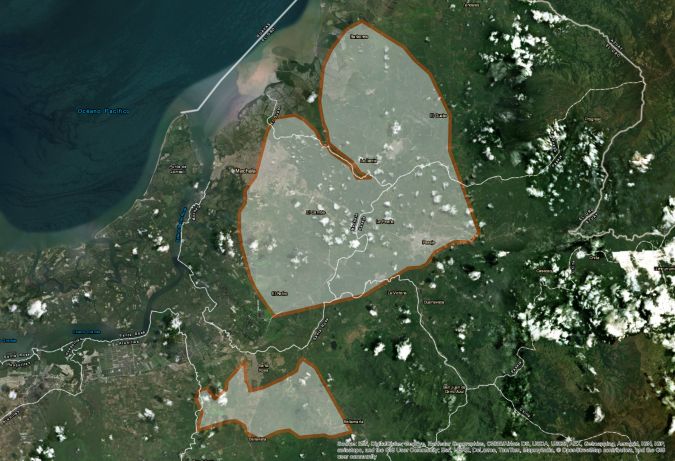
For over 60 years, the decentralised provincial government in El Oro, Ecuador, has been committed to the agro-productive development of the province. As part of this, it has promoted the construction, management and maintenance of a network of irrigation and drainage canals, thus supporting investments in the agro-productive sectors. To improve the efficiency of the water resources management, the government set itself the target of updating the users' register and surveying the technical and economic assessment of irrigation and drainage systems in the ’Pasaje - Machala’, ’Pasaje - El Guabo – Barbones’ and ’Santa Rosa’ territories. The aim of this survey was to identify the number of actual users of irrigation systems, quality of service, use and occupation of land, the types of crops and the type of irrigation system installed.
Scope of the Project
From a government perspective, the results would provide a significant basis for territorial planning (irrigation, viability, urban expansions, and the prevention of hydro-geological instability). The results would allow further agricultural development in the area through the optimisation of irrigation and canal management systems. Last but not least, the results would allow the government to optimise the property taxes and the implementation of fiscal equalisation mechanisms.
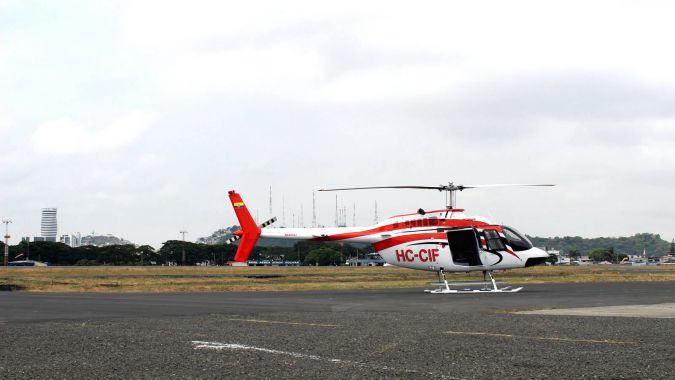
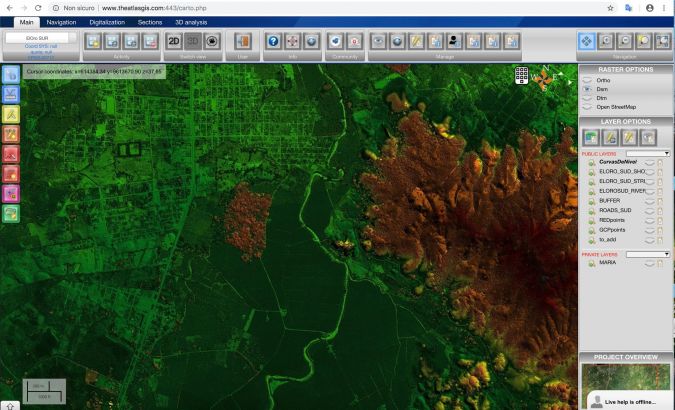
The more technical aim was to extract canals with almost fully automated techniques and, as much as possible, their geometric characteristics. The requirements of the project were very stringent (of the order of 10 cm in planimetry and 6 cm in altimetry) and the available time limited. The cartographic basis was defined by a geo-referenced photogrammetric survey integrated with Lidar data. As a platform, a Bell 206 helicopter was used (Figure 2). The results were disclosed through a structured GIS using the web-based AtlasGIS from MEDS Amsterdam.
Topographic Operations
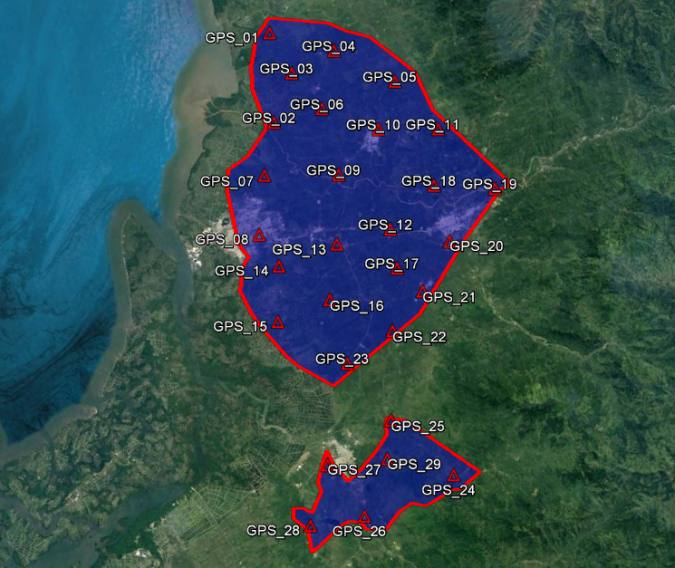
The Lidar and photogrammetric survey was based on a network of Ground Control Points, built according to IGM specifications (Instituto Geográfico Militar) of Ecuador regarding the location of ground control stations and the observation times of the static GNSS measurements (Figure 3).
During the photogrammetric survey, a GNSS receiver was set up on one of the topographically surveyed points in such a way as to occupy a barycentric position with respect to the area overflown. The receiver, set up in this way, had a sampling interval of 2 Hz and was active at least one hour before and one hour after the flight period. For the complete survey of the 29 vertices of the topographic network, four dual frequency Leica 1200 GPS and GLONASS receivers were used. The processing of the static GNSS survey was also done to IGM specifications. The adjustment computation was performed with the Leica Geo Office rel 7.0 software giving an overall accuracy below half a centimetre horizontally and a maximum of one centimetre in height.
Photogrammetric Survey
For the photogrammetric part of the survey, a medium-format Leica RCD30 camera of SwissLiDAR was used. This camera has a 53mm focal length, a resolution of 8956 x 6708 pixels and a pixel-size of 6 microns for the visible part of the spectrum. It can also collect Near Infrared (NIR) with a resolution of 4478 x 3654 pixels and a pixel-size of 12 micron.
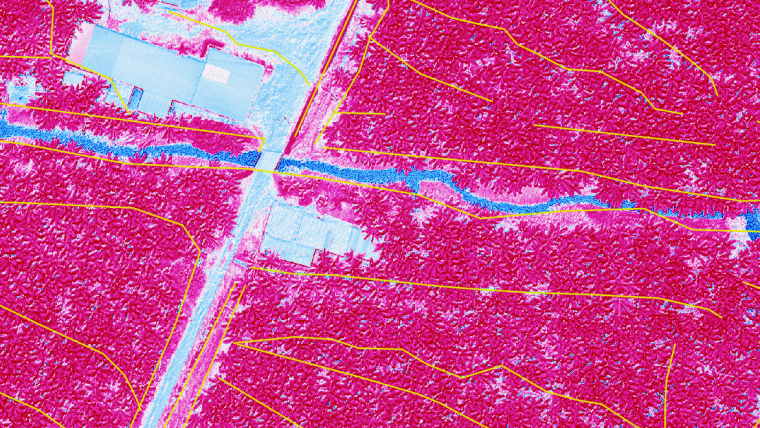
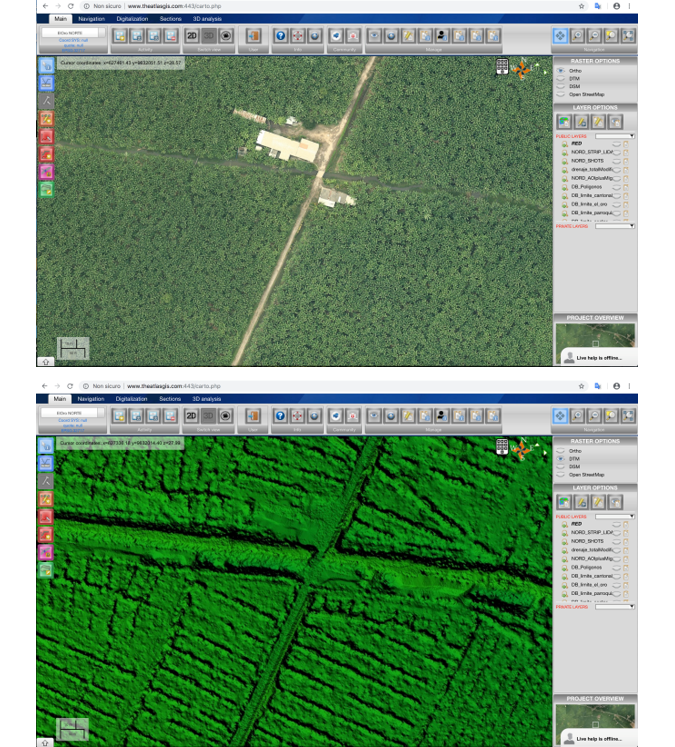
The camera is integrated with a dual frequency L1 / L2 NovAtel SPAN GPS and GLONASS receiver and an IMU sensor rigidly mounted on the camera body. The survey was designed to create a GSD (Ground Sample Distance) of 10 cm. The flight operations were carried out in the hours around noon to limit the shadows.The deliverables of the photogrammetric part of the survey were a RGB ortho-image with 10 cm resolution, a CIR (Colour Infra-Red) ortho-image and a NDVI (Normalized Difference Vegetation Index) with a resolution of 20 cm.
Lidar Survey
A Leica ALS70 Lidar sensor, property of SwissLiDAR, was used. This Lidar is characterised by a frequency of 250,000 points/sec and a height accuracy better than 10 cm (1σ) (Figure 4).
The survey was planned in such a way that a density of 6 points / sqm would be obtained. Every strip of data was mosaicked in the Prometheus software of MEDS Amsterdam to verify the correct alignment between the data in each strip and the ground control points. The strips were also processed to obtain a high quality, dense point cloud that was compatible with the technical specifications required. The Prometheus software used homologous points in the overlap of strips and around the overlaps to assess the best translation between the strips to reduce potential geometry inconsistencies.
The Lidar point cloud was then classified using algorithms developed for this project to identify what belongs to the ‘ground’ and what is above ground (vegetation, buildings ...). A specific difficulty in this project involved the challenging cirumstances represented by the banana plantations.
The algorithm as implemented in the Prometheus software involved the following steps (figure 5). It first subdivided the point cloud based on the chorographic characteristics such as the type of area (urban, agricultural, free plantations etc). It then searched for objects with special geometries, like buildings, infrastructures and anything man-made above ground and classified them as ‘above ground’. With the resulting point cloud, a mesh of points was generated for those points that undoubtedly belonged to the ground and, through successive iterations, the mesh was reinforced with all the ‘ground’ points.
The mesh thus created was then used to search and extract canals. After the extraction of the canals, they were semi-automatically classified in three hierarchical orders. For this, a section was classified in profile mode on AtlasGIS and the remainder of the canal followed using its relative arrangement based on the profile.
The deliverables of the Lidar data were a Lidar point cloud, both in overall and in ’ground only’ version, a digital terrain model (DTM) and digital surface model (DSM) with a resolution of 20 cm and, finally, contour lines for every 10 m height difference.
Results Obtained
All data in this project has been uploaded to AtlasGIS. With this software, the user can view the data through custom sections in areas of interest, see the 3D point cloud, calculate land movements, perform hydrogeological analyses, do advanced 3D measurements, etc. The database created is an effective tool for territorial management both from a technical and an administrative point of view. It can be used for the planning of territorial interventions, the implementation of methods for managing territorial-based economic units and to allow equalisation mechanisms from a fiscal and land-based point of view.
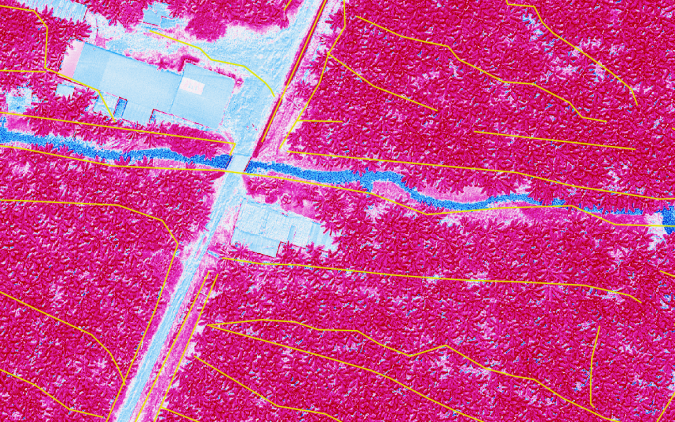
Through the analysis of the land morphology, it was possible to identify, with almost completely automated techniques and with a very low error rate, an additional 400 km of canals on top of 200 km of already detected canals. As a result of the survey, the irrigated and therefore taxable surface increased from around 15,000 to over 37,000 ha, with a significant advantage in terms of eligible land. The comparison with the actual situation of irrigated land was possible using NDVI images, through which the actual use of irrigation water could be assessed by analysing the vegetation status and water stress of planted areas. It is estimated that the entire survey operation was fully paid for with the first year of new taxation (Figure 6).
In addition to the objectives above, it is now also possible to use the digital models and ortho-imagery to improve hydrogeological knowledge. An example is the mitigation of significant issues affecting the area through using predictive rainfall models, based on the prepared geometric models integrated with the geological and agronomic properties of the land. The infrared ortho-imagery has allowed the identification and highlighting of vegetated areas. This information can now become a basis for subsequent multi-temporal analysis in subsequent surveys.

Value staying current with geomatics?
Stay on the map with our expertly curated newsletters.
We provide educational insights, industry updates, and inspiring stories to help you learn, grow, and reach your full potential in your field. Don't miss out - subscribe today and ensure you're always informed, educated, and inspired.
Choose your newsletter(s)


