Solar Atlas of Berlin
Airborne Lidar in Renewable Energy Applications
Airborne Lidar has yet to become as ubiquitous as aerial imagery for GIS applications. But one important use has recently been identified. An online atlas of potential solar energy yield was created for the city of Berlin by measuring parameters such as roof area and slope, taking into account shadowing from vertical objects such as chimneys and masts. The atlas is freely accessible to home and business owners and the hope is that it will create more demand for photovoltaic and solar thermal panels.
Display bigger map
Initial calculations for the German city of Berlin have suggested that about two-thirds of the entire energy consumption of households and small businesses could be generated on its roofs. VirtualcitySYSTEMS developed its Lidar processing software (BuildingReconstruction) to automatically create building attributes such as ridge and eaves height, roof slope and orientation, and worked in co-operation with FH Osnabrück on a first pilot project to create an atlas of potential solar energy yield for Berlin (see Figure 1).
Energy Efficiency
The efficient use of energy and development of renewable sources has become an important aspect of the debate concerning global climate change and environmental politics. The Berlin solar atlas was facilitated by calculation of roof solar potential (SUN-AREA 1) developed by a team of researchers led by Prof. Dr. Martina Klaerle at the University of Applied Science at Osnabrück (Germany). The aim of SUN-AREA, an ongoing research project, is to determine how the use of solar power can be optimised on urban roof areas using photovoltaic (PV) and thermal solar panels. A computer-aided analysis technique using Lidar and plan-view data was developed to identify areas of high potential for the use of solar power. The method was to remotely determine the style of roofs using high-resolution sensors, and the atlas, now online for free access by residents, is primarily geared towards home and business owners. Until recently this sector has tended to avoid consulting an energy professional, since the common expectation is that of minor savings potential.
Potential Yield
The method was first implemented in two pilot areas with a total area of nineteen square kilometres in Berlin. Around Friedrichstraße and a residential area in Lichterfelde, 14,300 roofs were evaluated for solar suitability (Figure 2). A potential yield of about 100 gigawatt hours of solar power per year was measured, which could be produced using an aggregated roof area of slightly more than 0.8 square kilometres. This corresponds to roughly 1% of Berlin's total power consumption. Preliminary estimates for the entire city of Berlin suggest that about 67% of private power consumption in Berlin could be generated on its roofs. Calculations for solar thermal use were also carried out.
SUN-AREA Method
A sequence of algorithms utilising grid and vector GIS functions is able to measure all necessary data, such as form, inclination, orientation and shaded areas of each roof. The algorithm yields the total energy which can be produced using solar power over the entire city and by each individual household. For solar potential analysis it is essential that even the smallest structures, such as dormers or chimneys, be taken into account; these areas are eliminated from the calculations as they reduce the total area available over which solar cells can be installed.
Lidar Data
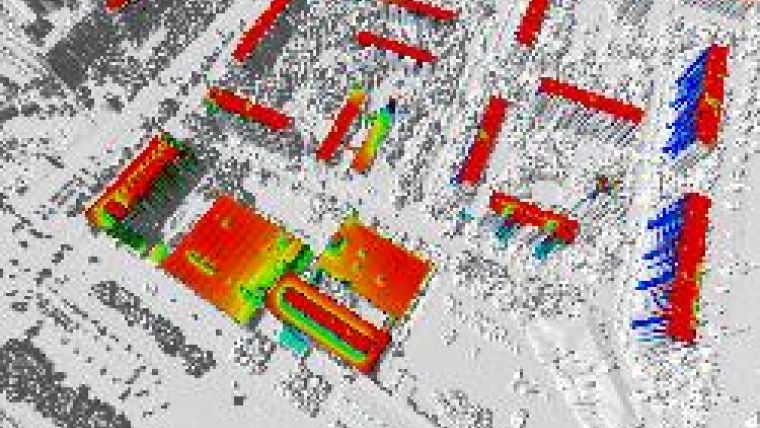
Lidar data proved extremely useful for performing exact-site analyses of solar roof systems in large regions. With an accuracy of approximately 15cm in position and height, and point densities of 1 to 15 points per square metre, these data have enormous potential (Figure 3). High accuracy means homogeneous roof areas can be selected; roof superstructures such as dormers or chimneys can be identified, and site parameters such as roof exposition, roof slope, size of roof area and insolation energy determined. The method is based on a thresholding operation which allows selection of homogeneous roof areas.
Shading Analysis
Lidar data also allow calculation of an all-year shading analysis for the entire area. This is possible by taking into account any objects that create a shadow, such as vegetation, high buildings or objects like poles (Figure 2). Shadows cast by vertical objects onto solar panels can cause significantly greater power reduction than sub-optimal orientation of the generator. Even partial shading of a module can diminish the overall performance of the installation; any degree of solar generator shading should therefore be avoided.
The radiation-tracking algorithm determines changing strength of incident solar radiation on the roof throughout the day for different seasons. A roof pixel is classified as shadow if an obstruction cuts the beam. Every area of roof shaded during the period of observation is deemed unsuitable for PV use and thus excluded from further calculations.
Classifying Potential
In the final process of the methodology, polygons are generated representing homogeneous non-shaded areas of the roof in both slope and orientation. Parameters of solar energy potential are calculated for each suitable area: insolation, roof size, potential electricity generation, potential CO2 savings, power in kilowatts and investment volume.
Roof areas appropriate for PV technology have access to 75-100% of the maximum possible local radiation energy, are not affected by shadow, and have an area of at least 15m² (pitched roofs) and 45m² (flat roofs). It is desirable to install solar panels on pitchmen roofs, however, using about 40% of the roof area. Solar thermal technology uses a smaller surface area.
Online Solar Map
Implementation of the Berlin solar map as a Web-GIS project has three main objectives: to display the location of existing solar installations in the city (photovoltaic, thermal and energy concepts), to visualise the potential solar industry in Berlin as points-of-interest, and to highlight rooftops suitable for solar panel installation (Figure 4). Using airborne Lidar (four points per metre square), the SUN-AREA (website 2) team analysed two test areas, including rooftops (slope, area and azimuth), shading from vegetation and neighbouring buildings, and statistics on total annual radiation from the German weather service (twenty-year average).
For each PV and thermal location that received a positive evaluation, a more accurate calculation was made of power generation potential in megawatts per year, estimated yearly CO2 reduction, and estimated capital expenditure required for installation and set-up. Using Autodesk AutoCAD MapGuide 3D (Figure 5), virtualcitySYSTEMS (3) integrated the results of solar calculation, local solar industry information and existing solar installation via databases to the online portal of the Berlin Business Location Center (4)

Value staying current with geomatics?
Stay on the map with our expertly curated newsletters.
We provide educational insights, industry updates, and inspiring stories to help you learn, grow, and reach your full potential in your field. Don't miss out - subscribe today and ensure you're always informed, educated, and inspired.
Choose your newsletter(s)


