Surveying in the land of fire and ice
The implementation of geodetic datums in Iceland: a challenging journey
Geodesists and surveyors in Iceland face considerable challenges due to the deformation effects of earthquakes, volcanic eruptions and glaciers on the geodetic networks. This article provides insight into the impact of this dynamic situation on the country’s geodetic datums over the past decades.
Iceland is situated at the boundaries of the Eurasian and North American tectonic plates, which are drifting apart at a rate of around 10mm/year. The plate boundaries interact with a deep-seated mantle plume currently situated under the Vatnajökull glacier. This creates a complicated pattern of rift and transform fault zones which is every geophysicist’s and geologist’s dream, but quite a challenge for geodesists and surveyors. Due to the plate tectonics, the geodetic networks are constantly deforming at a similar speed as human nails grow. Earthquakes and volcanic eruptions can cause sudden and serious deformation, in some cases by up to several metres. This usually occurs locally but can sometimes affect larger areas, depending on the nature and the magnitude of the event. The current changes in the climate are also affecting the geodetic networks; Iceland’s glaciers have been melting considerably over the last decades, not only causing the land to rise and therefore vertical deformation, but also some horizontal deformation. Additionally, there are some signs of local man-made deformation, mainly land subsidence due to utilization of geothermal power.
ISN93
The first modern GPS-based geodetic network in Iceland, ISNET93, was measured in 1993 and a new coordinate system/datum called ISN93 was published in 1997. It replaced the obsolete Hjörsey55 datum. In the subsequent years, several GPS surveys were carried out to densify the network and to connect it with the old Hjörsey55 and other local systems. When working in areas at and close to the plate boundaries, it soon became evident that crustal deformations due to plate tectonics were causing problems. It was not possible to achieve a satisfactory network adjustment result when keeping ISN93 points fixed on both sides of the plate boundaries. Additionally, two earthquakes of magnitude 6.5 occurred in south Iceland in the summer of 2000. Since this was not unexpected, it was incorporated in the ISN93 regulations that the geodetic network should be measured – and a new coordinate system/datum should be published – at least every ten years.
ISN2004 and problems with implementing a new datum
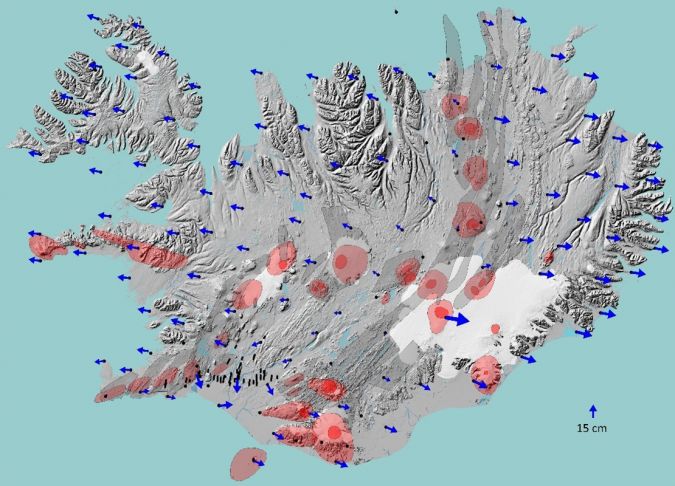
The geodetic network was measured for the second time in 2004. The results clearly showed the deformation at the plate boundaries. It also showed the effect of the earthquakes in 2000 and the vertical deformations caused by the melting of the glaciers. It is worth noting that according to the International Terrestrial Reference Frame (ITRF), Iceland is moving northwards at around 2cm/year, with the North American plate moving at a slightly higher rate. This movement is usually subtracted when analysing the deformation.
Adoption of the new datum ISN2004 failed. Many users had only just adopted ISN93 and were very reluctant to change over to ISN2004. Most GIS data did not accurately reflect the deformation between ISN93 and ISN2004. Developing grid transformations and getting them into GIS software also took some time. Moreover, some users argued that by the time they had adopted the new datum the NLSI would be set to publish another new one, so they preferred to wait for that one. Therefore, the ISN2004 datum is hardly ever used, even though it is the official datum of Iceland. But this does not change the fact that ISN93 is deforming – usually slowly and sometimes suddenly. As a result, survey results in the deformed areas are dependent on the benchmarks that are used as a reference. It is also complex to run a modern nationwide RTK-correction service in a constantly deforming but static coordinate system.
Therefore, it was clear that the next datum would have to address the deformation in order to extend its lifetime and ensure it was not obsolete by the time it was finally adopted by everyone. Experts from the National Land Survey of Iceland (NLSI) discussed this problem with colleagues from New Zealand who are dealing with a similar problem in terms of crustal deformation. One colleague told them: “The users want to have accurate coordinates, but they don’t want them to change”. To solve this predicament, NZGD2000 has been introduced in New Zealand as a semi-dynamic datum. The datum definition is kept frozen at a certain epoch in the ITRF. A velocity model is used to account for secular motions and patches are used to correct for earthquake deformation. The main benefit of this approach is that it can be treated as a static datum in many cases and applications, but the deformation can also be taken into account when needed. Another option would be to have fully dynamic datum in a global reference frame assigning velocities to every coordinate.
ISN2016: a dynamic approach
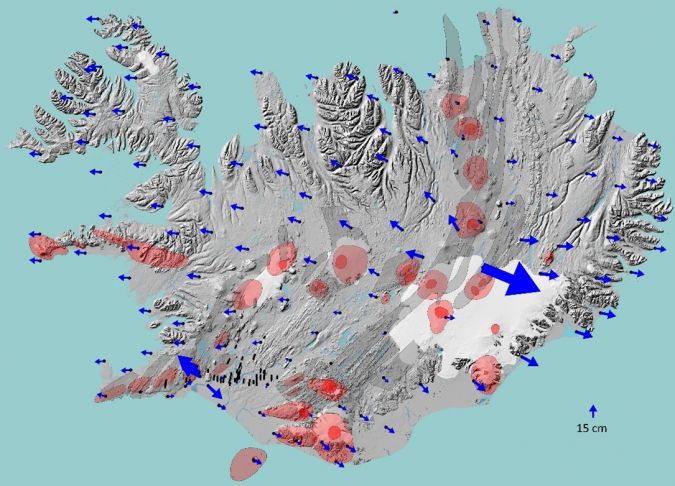
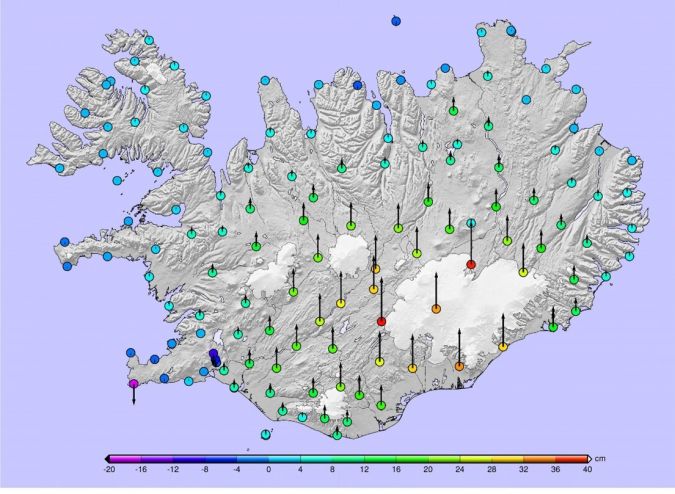
This was taken into consideration when planning the third measurement of the geodetic network, which was performed in 2016, and introducing the next coordinate system for Iceland. As expected, comparison with previous ISNET campaigns showed deformations due to plate tectonics and effects from the main geophysical events in the period from 2004-2016. An earthquake in south Iceland in 2008 caused more than 0.45cm deformation between the towns of Hveragerði and Selfoss, which are just 15km away from one another. The effect of the eruption in Holuhraun, north of the Vatnajökull glacier, in 2014-2015 was also very clear – not only in Kverkfjöll, where the eastward movement was 0.654m compared to 0.079m in the period from 1993-2004, but also in all the surrounding points. Jumps are visible in GNSS time series more than 150km away from the eruption site.
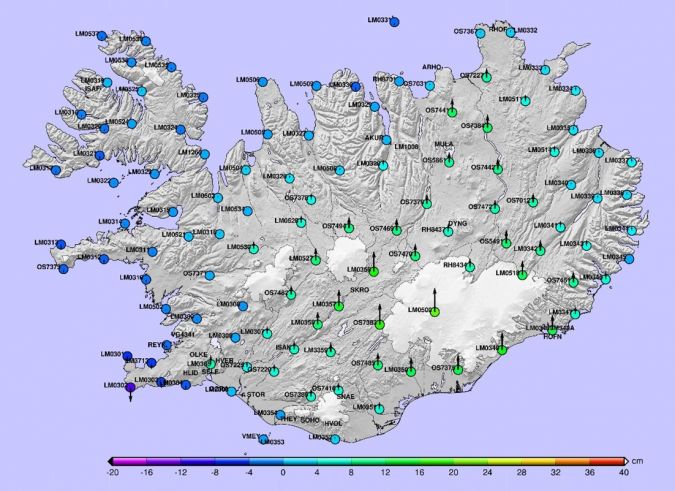
The most interesting results were the vertical changes. There were some indications from cGNSS time series in central Iceland of acceleration in the land uplift after 2004, and the comparison confirmed this both in central Iceland and along the southeastern coast. In the area south of Vatnajökull, the observed land uplift was around 30cm from 2004-2016 compared with only around 10cm between 1993 and 2004.
The new ISN2016 datum for Iceland is a semi-dynamic datum. Its counterpart, ISN_DRF, is a local realization of the current global reference frame at any time, based on the coordinates and station velocities of the IceCORS cGNSS network. This approach enables a surveyor to choose the appropriate method depending on the particular area and the required accuracy. Along with this, the NLSI has published transformation grids, the first version of secular velocity model and a new geoid to account for the vertical changes from 2004 to 2016 since the vertical reference system of Iceland (ISH2004) is connected to the same epoch as ISN2004. EPSG codes are available for ISN2016 and its transformation to older ISN systems. The online transformation service called cocodati has been updated and a nationwide RTK correction service which is free of charge for all users will be finalized before the end of 2021.
Some external factors have been favourable. The increased use and development in PPP-RTK for surveying and precise navigation has created a greater need for precise velocity and transformation models since the results are always in the current global reference frame at the epoch of the observation. This means that more nations are working on these issues. For example, the Nordic Geodetic Commission recently launched a study project called DRF Iceland providing a fruitful forum to study various issues related to dynamic datums and time-dependent coordinates.
One of the key factors in the adoption of ISN2016 is to get transformations, velocity and deformation grids into mainstream geospatial software. The recent development of the Proj transformation software and GDAL that are running in the background of many geospatial software solutions has made it easier for the NLSI to distribute and implement its models. This offers the possibility of more advanced coordinate transformations and other coordinate manipulation than its predecessor. Even though it is not possible to do this directly in GDAL with simple command lines, this will hopefully soon be implemented in a mainstream and user-friendly geospatial software solution. Moreover, the velocity model and the transformation grids are also available in the latest versions of the Trimble Access and Trimble Business Center.
The ISN2016 is still not widely used in Iceland, but with most pieces in place it should be easier to adopt than ISN2004. Since NLSI is not going to introduce a new datum in 2026, the adoption is less time-sensitive. Surveyors and others working in the geospatial industry are generally positive towards ISN2016, but they need a nudge to get started. But overall, solving the geodetic issues that that follow a semi-dynamic datum is less challenging than adopting a new datum.
Volcanic eruptions on the Reykjanes peninsula
The maintenance of ISN2016 is an ongoing project and the recent events on the Reykjanes peninsula – the most southwestern part of Iceland – are posing some interesting challenges. There are seven towns on the peninsula and the capital city of Reykajvik is in its backyard. The international airport of Keflavík is located in the northern part of the Reykjanes peninsula, plus there are two geothermal powerplants. The plate boundaries run through the peninsula, making it an active area. Small earthquakes are rather frequent and larger ones occur every now and then. The last volcanic activity on Reykjanes was between 800-1240 BC, but there are signs that we might be entering a new period.
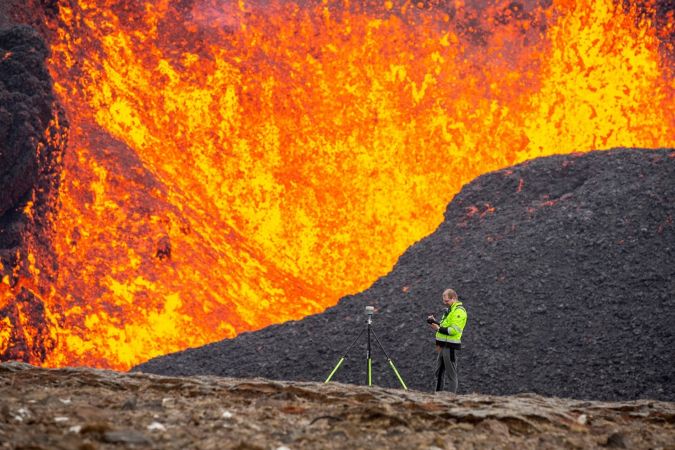
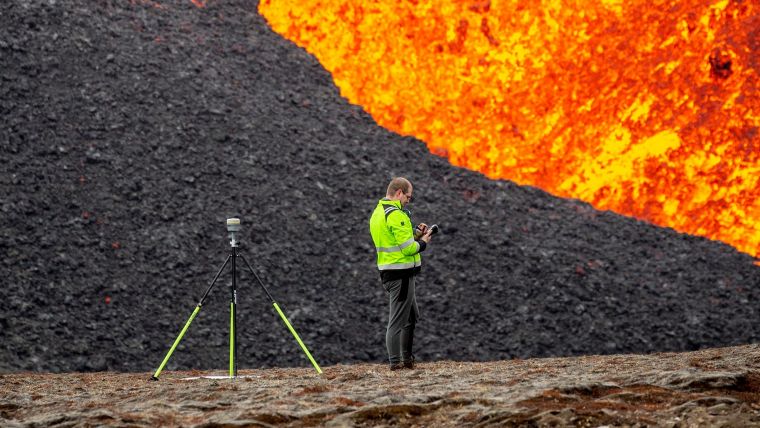
The unrest started in January 2020 with land uplift around the mountain of Þorbjörn close to the town of Grindavik and the Blue Lagoon. This was followed by two earthquakes of magnitude 5 in March and October 2020, then several smaller ones. On 24 February 2021 an earthquake of magnitude 5.7 occurred. Around 60,000 earthquakes followed in the subsequent weeks and INSAR and GNSS data showed clear signs of magma intrusion. On 19 March an eruption started in Geldingadalir, just east of Fagradalsfjall and 9km northeast of the town of Grindavík. The location of the eruption did not pose an imminent threat to the general population or infrastructure. However, since it was so close to inhabited areas and infrastructure, it was necessary to closely monitor the effusion rate, volume and area of the new lava in order to predict the threat if the eruption would continue for some time. This was done by frequently carrying out aerial surveys over the eruption to generate a DSM and orthophotos. This work involved close cooperation between the NLSI, the Iceland Institute of Natural History and the University of Iceland’s Institute of Earth Sciences.
One of the tasks of the NLSI was to establish a network of ground control points (GCPs) in the area and ensure a common reference system for all parties involved in the aerial surveys, both for response and research. The obvious choice was to use ISN_DRF and it was decided to use the epoch 2021.4. Coordinates of cGNSS stations installed by the Institute of Earth Sciences (IES) and the Icelandic Met Office (IMO) close to the eruption site were computed and the stations were monitored. If any large movements occurred, the coordinates would be revised. Although there have been no significant movements, one of the cGNSS stations was lost under the lava in July 2021. Over 20 flights missions were carried out during the eruptions, providing vital information on the progress.
Conclusions
Iceland’s dynamic geodetic situation can be challenging for surveyors, but it also presents opportunities for interesting and exciting projects. Maintaining the geodetic networks in Iceland is a never-ending task. It is necessary to implement a datum with time-dependent coordinates, velocity and deformation models in order to keep pace with the latest developments in the geospatial world. Perhaps the biggest task is to make this as easy as possible for the users, and this is being supported by recent developments in open software like PROJ and GDAL.
Eruption update
There has been no volcanic activity on the peninsular since 24 September 2021, but the end of the eruption has still not been declared since there are frequent earthquakes just a few kilometres north of Fagridalur, close to the mountain of Keilir. The new lava already covers 4.85km2 with an estimated volume of 150 million cubic metres. But now that the unrest seems to have come to an end for a while, NLSI can start working on a deformation model of the event to be included as a patch in ISN2016.
Further reading

Value staying current with geomatics?
Stay on the map with our expertly curated newsletters.
We provide educational insights, industry updates, and inspiring stories to help you learn, grow, and reach your full potential in your field. Don't miss out - subscribe today and ensure you're always informed, educated, and inspired.
Choose your newsletter(s)


