The use of airborne Lidar to visualize history in 3D
Bringing a Canadian fort to life
Airborne Lidar and 3D modelling technologies were used at the historic site of Fort Anne in Nova Scotia, Canada, not only as an aesthetic recreation of history, but also to help scientists decide where to focus future excavation activities.
Airborne Lidar and 3D modelling technologies have emerged as highly valuable geospatial tools available to archaeologists in their efforts to gain insights into key historical sites. Being able to accurately visualize how a fort, battlefield or settlement appeared at critical times creates a narrative revealing the way important events played out. Just as importantly, 3D visualization enables the researchers to plan where to focus additional fieldwork, including excavation and geophysical surveys.
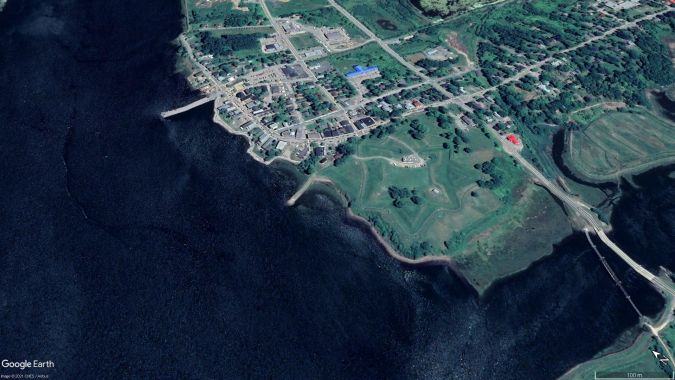
One such historic site is Fort Anne in Nova Scotia, Canada, located among the oldest and arguably most intriguing European settlements in North America. In 1605, two years before the English established Jamestown in present-day Virginia, French explorers set up a fur-trading post in an area they named Acadia. The settlement grew, and about a century later France began building a Vauban-style, or star-shaped, fort to protect the settlers.
The structure, today called Fort Anne, endured deadly attacks from numerous enemies for several years before finally falling to Britain in 1710. Under British rule, the fort later played a pivotal role in a tragic event known as the Acadian Deportation in which many French settlers were forced from the area. Some eventually made their way to Louisiana where a mispronunciation of the name ‘Acadians’ led them to be known as ‘Cajuns’.
The growing role of geospatial in archaeology
Considering its age, Fort Anne is relatively well preserved. Having been designated Canada’s first national historic site in 1921, it serves as a park today. As both a research and instructional project, the Anthropology Department at Saint Mary’s University (SMU) in Halifax decided to bring the fort and nearby town back to life using state-of-the-art visualization techniques.
The application of GIS technology for mapping purposes in archaeology and anthropology has increased dramatically in the past decade, but the regular use of advanced remote sensing tools and visualization methodologies has been embraced at a much slower rate. The cost of many datasets and software packages is one hindrance to widespread adoption in academia. However, Saint Mary’s University is actively finding ways to put these vital tools in the hands of its scientists and students. This is crucial because archaeologists hired into private-sector employment are increasingly finding that familiarity with geospatial datasets and software is a job requirement.
Locating primary datasets
For the Fort Anne project, the first step was to obtain airborne Lidar data for the area. In Nova Scotia, this task is easier than it sounds thanks to the province’s open data initiative, in which raw data is made freely available via the online Elevation Explorer portal. Open data policies across Canada are giving taxpayers in all walks of life access to numerous government-funded datasets, including Lidar, orthoimages, maps and aerial photos.
With regards to airborne Lidar, most of Nova Scotia has been covered and is available. Datasets captured by RIEGL VQ1560i and Q780 sensors at a pulse spacing of 0.4m were obtained by SMU researchers for the Fort Anne area. The Lidar data was loaded into Surfer, a surface mapping package from Golden Software in Colorado. Typically relied on for 3D visualization in oil & gas exploration, mineral extraction and environmental consulting, this easy-to-learn product is becoming a favourite of archaeologists for 3D terrain mapping. Its affordability and accessibility have made it a primary geospatial teaching tool at SMU Anthropology.
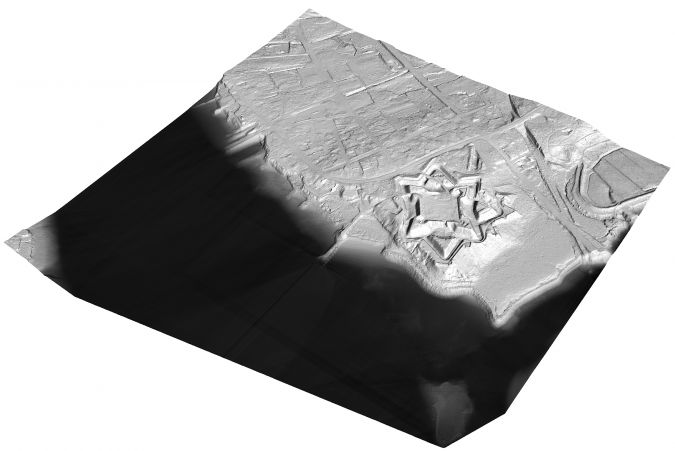
The Lidar point cloud was filtered in Surfer to create a bare Earth digital elevation model (DEM) of the surface by removing buildings and vegetation. Modern features such as these, though interesting in some applications, tend to obscure the archaeological landscape. Researchers used a simple function in the software to exaggerate the Z values in the DEM to enhance the relief and sharpen the fort’s ramparts and other earthworks that have eroded over time. The other enhancement applied to the DEM was the Hillshade relief function, which allowed the scientists to change the direction and angle of illumination on the fort to give it the most striking appearance in the visualization.
Preparing antique maps as 3D overlays
The next phases of the effort can be chalked up to astute research and luck. Fort Anne was so important to France and England in the 1700s that several maps of it were created. Sites of conflict often received more attention from cartographers than other places, and that was certainly the case for this site. Fort Anne and its associated town served variously as a French and British garrison and administrative centre. Military engineers stationed at the fort consequently made this one of the best mapped places in the colony – a boon to modern archaeologists who are intent on plotting lost dwellings, gardens, orchards, wharves, mills, churches and cemeteries.
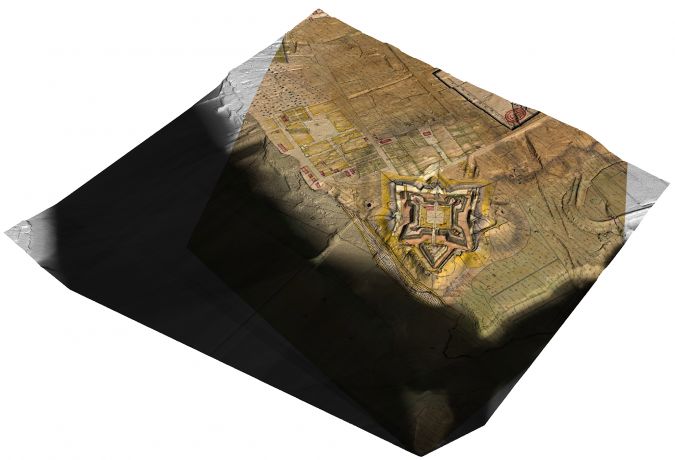
Remarkably, a digitized version of a still-existing 1706 manuscript map was obtained from the French National Archives. As if fate hadn’t been tempted enough, a British map dating from 1753 was located in the U.S. Library of Congress. Both had already been digitized and were available online.
Before being merged with the DEM, however, the maps had to be georeferenced. This process was undertaken in another software package using a series of fixed control points the SMU scientists obtained from a 1:10,000-scale basemap – also obtained for free on the provincial data portal. Control points were selected using features in the landscape that were mapped in historic times and had not moved or been erased since. The fort’s bastions provided convenient control points, as did intersections of streets in the neighbouring town of Annapolis Royal.
Revealing an 18th-century star fort
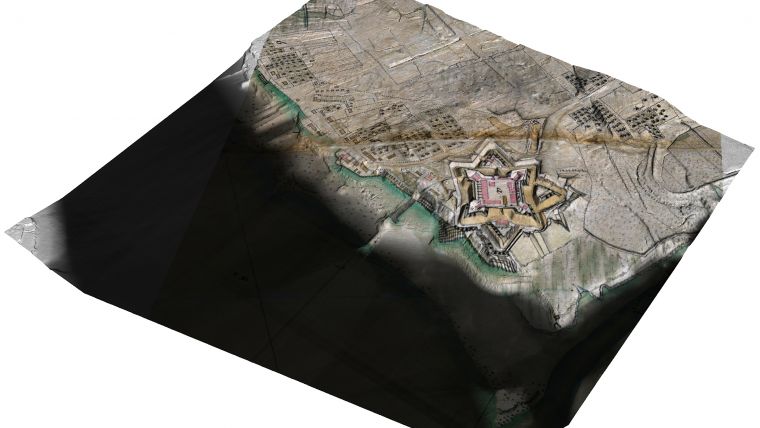
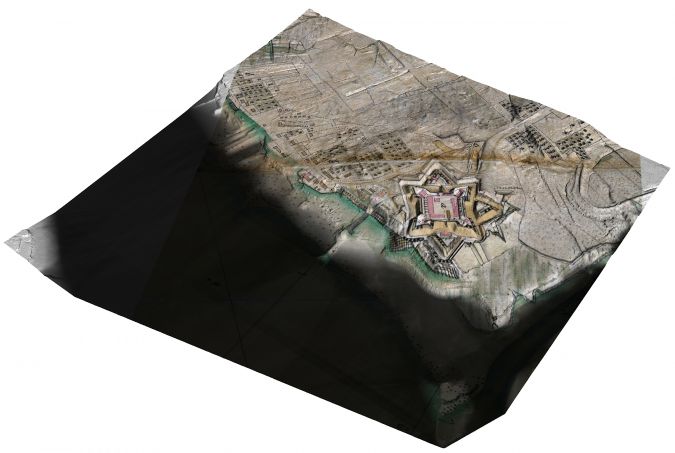
Once georeferenced, the old maps were exported as geotiffs and dropped back into Surfer where they were overlaid on the 3D Lidar surface, a simple process that only required the DEM and maps to be in the same projection. These steps could have been performed in a GIS package, but the procedure would have been more complicated. The results were two realistic 3D maps of Fort Anne, one from 1706 under French rule and other from 1753 under British command.
However, the creation of the 3D visualization was really only the beginning of the archaeologist’s work. The next important step was to interpret it. The ability to collate historical mapping with highly resolved elevation data in a vivid visualization is a great asset for archaeologists. It helps to contextualize past engineering decisions by better revealing the dialogue between architecture and environment.
3D visualization can also reveal subtle signs of past human handiwork in the terrain, like a cartographer’s line correlating to a silted-up ditch, or a flat patch of ground where a house once stood. In today’s jargon, this visualization is revealing patterns of life in Fort Anne and nearby Annapolis Royal that comprise an evolution from fur-trading activities to military outpost to modern historic park.
What’s next?
At Fort Anne, the visualization not only serves as an aesthetic recreation of history, but scientists are also relying on it to decide where to focus future field activities which will include traditional excavation with spades and trowels. But in addition, ground-penetrating radar and electromagnetic induction devices may be brought to the site in an attempt to see what is still hidden beneath the Nova Scotia soil. Furthermore, the Saint Mary’s team has already begun recreating this Lidar and 3D visualization process at other important Canadian historical sites.
Further reading
www.pc.gc.ca/en/lhn-nhs/ns/fortanne/culture/histoire-history

Value staying current with geomatics?
Stay on the map with our expertly curated newsletters.
We provide educational insights, industry updates, and inspiring stories to help you learn, grow, and reach your full potential in your field. Don't miss out - subscribe today and ensure you're always informed, educated, and inspired.
Choose your newsletter(s)


