UAS in the Andes
Determining Volume Changes of the Chuquicamata Open Pit Mine
This article was originally published in Geomatics World.
In mining, the determination of volume changes over time is an important surveying task. However, harsh environments can make gathering precise and up-to-date geodata challenging. Traditional land surveying and terrestrial laser scanning are faced with many hurdles when used in remote open pit mines. UAS provides an alternative without compromising accuracy. Here, the authors present UAS surveys carried out high in the Andes.
The gathering of information in open-pit mines is associated with many risks. If security protocols are not strictly followed, heavy equipment may injure surveyors operating on site. In addition, digging ore produces dust, noise and other unfavourable working conditions. When located in mountainous areas temperature may be well below zero. Access is often limited due to safety regulations, or even impossible due to the harsh environment. Terrestrial laser scanning (TLS) is a proven tool under such conditions but requires substantial investment and logistics as well as many set-up points to avoid blind spots. A UAS allows regular aerial surveys to be conducted without blind spots. Also, there is no need for access to the pit as a UAS can be remotely piloted, while the efficiency and timelines of a photogrammetric workflow can be fully exploited.
Chuquicamata Mine
Chuquicamata, Northern Chile, is the biggest open-pit copper mine by excavated volume in the world, and at 1,000m from top to bottom, it ranks second in terms of depth (Figure 1). The diameter is 4km. Particularly, the depth level between 200 and 400m is being explored at present and thus has to be surveyed regularly. The pit lies at 2,800m above sea level; wind speed and direction may change rapidly which precludes replication of flight plans, while turbulences can cause air drops of several metres which requires the endurance of a fixed wing. The high altitude raises energy consumption and thus reduces flight time, while safe landing zones are rare. Since landing places may be small and rough, lightweight fixed wings are preferred in order to prevent damage to aircraft. To preserve a constant ground sample distance (GSD) the height above ground has to be upheld, which further defines flight planning. The wind also causes dust to blow around which obstructs sight and thus contaminates the measurements, while digging may destroy ground control points (GCPs). However, experiences gained during numerous flights have given an understanding of where and when wind and dust are most severe, and this helps when defining the flight variables.
Volume Extraction
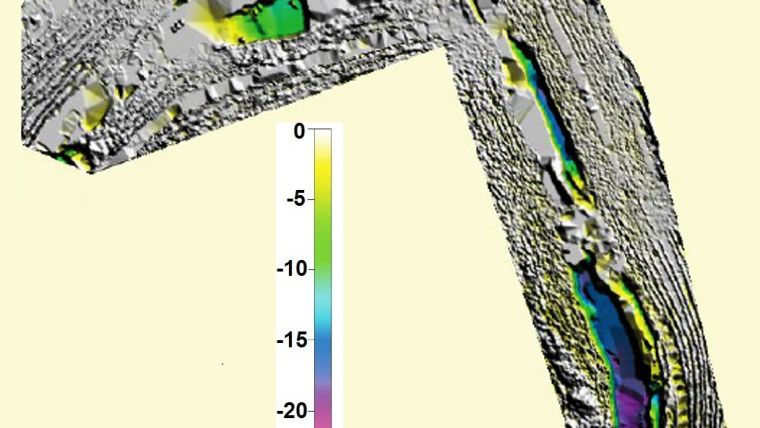
The UAS used was a senseFly eBee fixed wing, equipped with GPS / IMU and a 16MP Canon Ixus 125HS camera. During two months, weekly flights were conducted under equal circumstances. From the eight datasets, digital surface models (DSMs) were generated and volumes calculated. The features of the first dataset are presented here. The 266 images were acquired from a height of 250 metres with a GSD of 14cm. The images were processed with Pix4Dmapper within 1.5 hours on a standard desktop PC (a detailed description of Pix4Dmapper can be found in GIM International’s first UAS special, published in 2013). Over 758,000 key points were automatically extracted, of which 263,000 3D points were generated for use in the bundle block adjustment (BBA), achieving a mean error of 0.16 pixel. Five GCPs were used for georeferencing purposes and two as checkpoints. The height accuracy (1-sigma) was revealed to be 15cm which is consistent with the theoretical limit of 3 times the GSD. To create a DSM, all pixels were used resulting in 4 million height points. They were stored in a true-colour LAS format and automatically filtered and interpolated to generate a DSM with a GSD of 14cm. Figure 2 shows a sequence of DSMs and Figure 3 shows the volume change.
Comparison
Before the use of UAS, volume changes were computed from DSMs generated by TLS. Comparison shows that the volume computed from UAS imagery differs by less than 1% from the TLS volume. Hence, the accuracy of UAS is similar to TLS while UAS is safer, more efficient and more productive. Added to this, the orthomosaic created from the imagery and DSM can be draped over the DSM and this 3D digital landscape allows progress to be monitored and potential issues to be identified. Table 1 shows a UAS versus TLS workflow comparison when using two scanners.
|
|
TLS |
UAS |
|
Point density [pnt / m2] |
4 |
100 |
|
Operators |
4 |
2 |
|
Vehicles |
2 |
1 |
|
Need to access pit |
Yes |
No |
|
Time on site |
2 days |
6 flights in 4 hours |
|
Blind spots |
Yes, depending on topography |
No, because of vertical view and overlap |
|
DEM generation |
Extrapolation needed |
Only measurements used |
|
Availability of data |
3-4 days |
24-48 hours |
|
Traceability of data |
No |
DSM and DTM allow traceability and comparisons |
Table 1: Comparison between terrestrial laser scanning (2 scanners) and UAS.
Other Experiences
A flight over a 3.4km2 discharge area of a mine tailing dam, located in the Atacama Desert in northern Chile, revealed that perpendicular flight lines, resulting in an overlap of over 85%, were necessary to prevent reflecting water bodies from hampering automatic processing. The area was captured within 45 minutes; from the images with a GSD of 10cm, a dense DSM and accurate contour lines were generated. They provide indicators where soil and rock have slipped into the lake, which may cause flooding threats.
Conducting height measurements for creating a DSM of a 7.5km2 valley with height differences of 900m deep in the Andes can take 7 surveyors up to 10 days. Using UAS it took one day to install and measure 8 GCPs and one day to conduct 5 flights resulting in 1,290 images. Matching 12 million key points to generate 5 million tie points for BBA and next producing 50 million height points, both with Pix4D, took 12 hours on a standard Windows PC, resulting in a DSM and orthomosaic both with a GSD of 8.7cm.

Value staying current with geomatics?
Stay on the map with our expertly curated newsletters.
We provide educational insights, industry updates, and inspiring stories to help you learn, grow, and reach your full potential in your field. Don't miss out - subscribe today and ensure you're always informed, educated, and inspired.
Choose your newsletter(s)


