AAM Aids Flood Response in Queensland
When tropical storm Oswald hit the Australian town of Bundaberg in Queensland in late January 2013, resulting in extensive flooding, a number of crucial relationships came into play. AAM immediately responded to the request to deploy an aircraft to capture aerial imagery for digital mapping purposes, demonstrating the importance to protection and relief efforts of strong partnerships between response teams, government agencies and consultants.
This time, lessons learned from the Cyclone Yasi disaster, which had a devastating impact in the same region in 2011, ensured that everyone was well prepared. During such incidents, reliable and timely spatial data is critical to support the response and protection of life and property, entailing a strong partnership between response teams, government agencies and consultants. AAM immediately responded to the request to deploy an aircraft to capture aerial imagery for digital mapping purposes. This ensured that spatial data was captured and delivered more quickly and efficiently than ever before, thus aiding relief efforts.
For those living in Australia, natural disasters are an all-too-familiar occurrence. In January this year, Bundaberg in Queensland experienced an extreme weather event that delivered unprecedented volumes of rain resulting in major flooding across the region. Teamwork that evolved during the Cyclone Yasi disaster that caused such widespread damage across the area in 2011, enabled spatial data to be captured and delivered quicker and more efficiently than ever before. Drawing on this experience and, through a truly co-operative effort between numerous government departments and the private sector, the rapid collection and distribution of vast amount of aerial imagery was possible and made available to support the response and clean-up efforts. In the lead-up to the event, Emergency Management Queensland was closely monitoring ex-Tropical Cyclone Oswald as it headed towards Bundaberg. Lessons learned from the devastating floods across Queensland in 2011 ensured that everyone was well prepared. When a phone call was placed to AAM’s Brett O’Hagan on Saturday 25 January, an aircraft was immediately deployed to the nearest available airport and placed on standby. Working closely with various agencies, the peak of the flood was modelled to be at 3pm on Tuesday 29 January.
Challenging
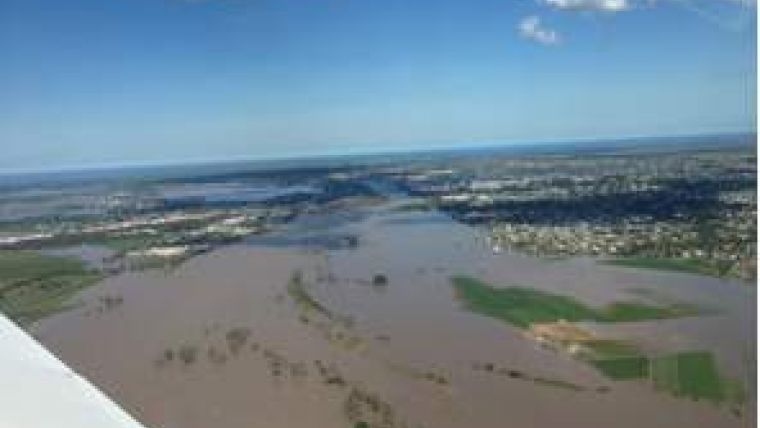
Capturing aerial imagery in January in Queensland is always challenging, and increasingly so in the aftermath of a cyclone. The mixed use of the imagery also poses challenges. The imagery needs to support the rapid response by providing a good visual record quickly and efficiently, but also needs to be a good-quality, accurate product for further use over time. By deploying a large format Digital Mapping Camera (DMC), AAM could capture high-resolution imagery at the peak flood time at flying heights dependent on the prevailing weather conditions. The flexibility of choice of sensor and the ability of the aircrew to adapt to the changing conditions was crucial to the successful capture.
This process provided an immediate visual record within 24 hours while providing post-identification and mapping from the imagery enabling the precise regeneration of flood lines and limits, critical to future planning.
Once captured, the data processing also posed numerous challenges. Scattered cloud, large continuous areas of water and sun glint all presented difficulties, and AAM was able to draw on experience gained during similar events to manage these challenges. The total area of expected inundation (over 500km2) was captured between 3pm and 6pm on the day of the flood peak (29 January 2013).
Imagery without delay
To assist in the response and recovery process, the imagery was required without delay once captured. Around-the-clock processing and streamlined workflows allowed a 2-day turnaround, and the data was made available to responders by Friday, 1 February 2013.
Capturing and processing the data was one challenge; delivering the data quickly and efficiently was another. To ensure the quickest possible delivery and accessibility to all those who needed the images, AAM delivered the data via OGC Web Mapping Tiling Services (WMTS) through its AAM GeoCloud service. This delivery method provided an open interface, easily scalable to a large number of users with the added ability to rapidly generate maps. This enabled the widest accessibility to the data as quickly as possible.
Aerial Data ntegrated in GIS Solutions
The data was then integrated into various websites and GIS solutions used by various departments involved in the response and recovery process. This smooth integration was critical to the success of disaster management and is a key feature of the AAM GeoCloud and its adoption of OGC Standards to deliver data.
The State Disaster Coordination Centre (SDCC), headquarters for the response work, had multiple teams working to coordinate the response. Geospatial services at the SDCC are co-ordinated by the Queensland Fire and Rescues Service (QFRS). Since 2011, AAM has been supporting the QFRS GIS team in the development of the Total Operational Mapping (TOM) system. TOM operates with QFRS’s other internal systems, to bring together multiple information sources – including data from the Bureau of Meteorology and Department of Transport and Main Roads – to create an interactive map of events as they occur.
Rapid Damage Assessment Reports
This provides a vital tool used across all levels of the response teams working within the SDCC and in the field. Real-time events are recorded, such as the status of SES Requests for Assistance (RFA) and the Rapid Damage Assessment (RDA) reports, which draw from photos and flood-level damage reports gathered by QFRS and Queensland Reconstruction Authority field staff.
TOM is based on the Geocortex software by Latitude Geographics and supported by AAM across Australia. By combining the power of ESRI’s ArcGIS Server product with the interoperability of OGC standards, the TOM solution is available to all Department of Community Safety staff, both on their desktops and as an HTML5 application on widely used tablet devices. Using an HTML5 application, live incident reports and the most recent images were available to the senior staff coordinating the response.

Value staying current with geomatics?
Stay on the map with our expertly curated newsletters.
We provide educational insights, industry updates, and inspiring stories to help you learn, grow, and reach your full potential in your field. Don't miss out - subscribe today and ensure you're always informed, educated, and inspired.
Choose your newsletter(s)


